This is in continuation to our ongoing tracking of OGDC wave structure.
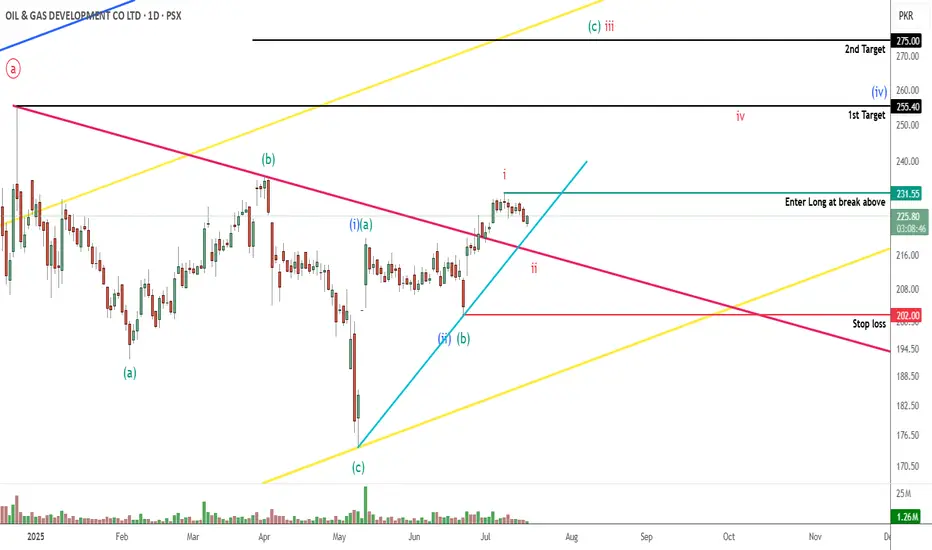
If our wave count is correct then prices will take support from the 220-210 levels and will target the upside level of 255 and 275. Our wave count suggest that prices might even go above 300+ but that depends on how strong the bullish move is, if the move stays strong then price will target the upper yellow trendline.
Alternately, if price goes below the 202 level, it will take price well below 174.
We will buy 25% positions at 220-210 levels (ideally 218-216) and 75% at the break above 231.56
Trade Setup:
Entry level: 217 & 231.56
Stop loss: 202
Targets:
T1: 255
T2: 275
T3: Yellow trendline
Let see how this plays, Good Luck!
Disclaimer: The information presented in this wave analysis is intended solely for educational and informational purposes. It does not constitute financial or trading advice, nor should it be interpreted as a recommendation to buy or sell any securities.
Note
Orders are in place, let see if we can get price of 217 todayNote
Price has started to rise, we will enter long position at break above 231.55Trade active
Entry level: 231.56Stop loss: 202
Targets:
T1: 250-260
T2: 275
T3: Yellow trendline
Note
T1 reached, closed 50% of the positions at 255Next target is T2: 275
Note
Do not forget to place your orders earlyNote
Make sure to place your orders early in the dayTrade closed: target reached
2nd target achieved, all remaining positions closed at 275.Overall performance -
Entry price: 231.56
Exit price: 255 (50%) & 275 (50%)
Profit @ share: 33.44
Gross profit: 14.44%
Disclaimer
The information and publications are not meant to be, and do not constitute, financial, investment, trading, or other types of advice or recommendations supplied or endorsed by TradingView. Read more in the Terms of Use.
Disclaimer
The information and publications are not meant to be, and do not constitute, financial, investment, trading, or other types of advice or recommendations supplied or endorsed by TradingView. Read more in the Terms of Use.