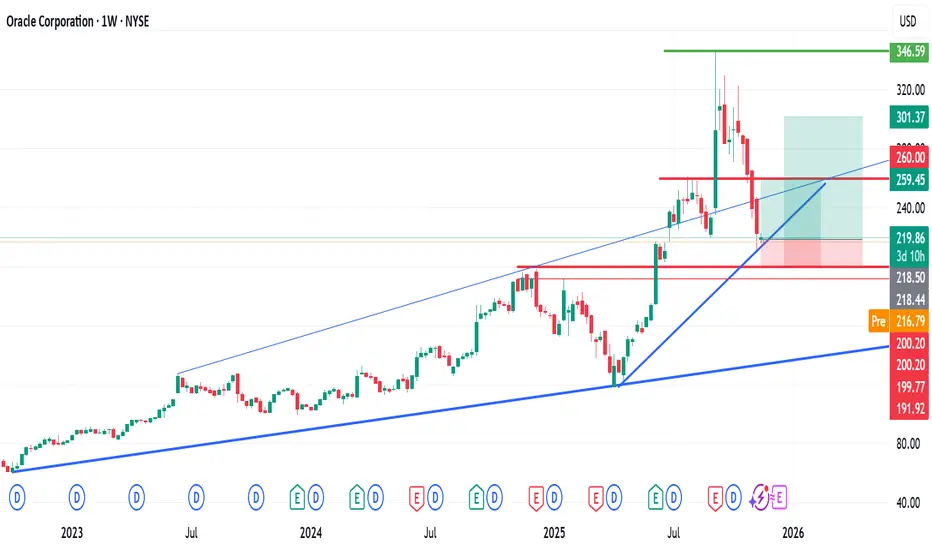
Oracle recently surged to an all-time high of approximately $346, followed by a sharp correction of more than 39%, bringing the price into the key Fibonacci 61.8% retracement zone.
This level has historically acted as a strong technical area for potential reversals.
The decline has also resulted in the development of an ascending trendline, which is currently serving as a major support zone on the chart.
Technical Outlook
Potential Buy Zones:
Entry Zones: $219.86 (Entry 1 & 2)
Target Levels:
TP 1: $260
TP 2: $300
Risk Consideration
If the ascending trendline fails to hold, the chart suggests a possible additional downside of approximately 8% before the next support region.
As always, apply strict risk management and adjust your position sizing accordingly.
Feel free to share your views—and kindly follow for more chart breakdowns and market insights.
Related publications
Disclaimer
The information and publications are not meant to be, and do not constitute, financial, investment, trading, or other types of advice or recommendations supplied or endorsed by TradingView. Read more in the Terms of Use.
Related publications
Disclaimer
The information and publications are not meant to be, and do not constitute, financial, investment, trading, or other types of advice or recommendations supplied or endorsed by TradingView. Read more in the Terms of Use.