Executive Summary:
Oscar Health, Inc. ( OSCR) presents a compelling technical setup suggesting a period of consolidation within a well-defined range. After a significant prior move, the stock is currently digesting gains and building a base for its next potential directional shift. Key Fibonacci retracement levels have provided both resistance and support, mapping out a clear roadmap for traders. The prevailing thesis is that OSCR is an undervalued asset, and its current technical posture offers a strategic opportunity for accumulation near strong support levels, with a primary buy zone identified at the $14.00 level.
Detailed Technical Breakdown:
1. Established Trading Range:
The stock has entered a phase of equilibrium, characterized by a clear consolidation pattern. The boundaries of this pattern are distinct:
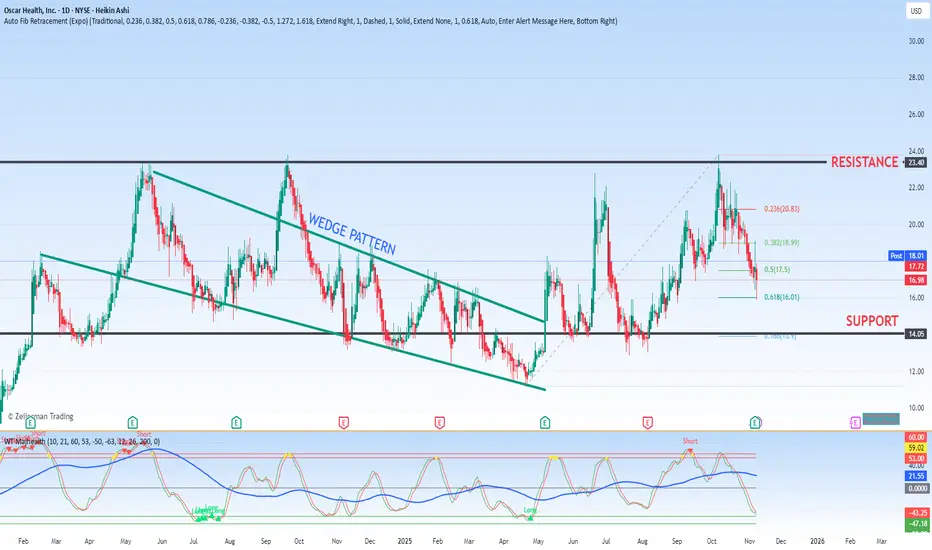
Upper Resistance: The $24.00 level has proven to be a significant technical and psychological barrier. On multiple attempts, the stock has been rejected from this zone, establishing it as a key ceiling for the current trend.
Lower Support: Conversely, the $14.00 level has acted as a robust floor. Each time the stock has declined to this region, buying interest has emerged, preventing a further breakdown and solidifying its role as a primary support level.
This consolidation between $14 and $24 indicates a battle between buyers and sellers, with neither side able to assert dominance. Such phases often precede a significant breakout once the market reaches a consensus.
2. Critical Fibonacci Retracement Analysis:
Applying Fibonacci retracement levels to a relevant prior price swing provides a mathematical framework for identifying potential reversal zones. The recent price action has interacted precisely with these key levels, validating their importance:
23.6% Level ($20.78): This level initially acted as a minor resistance point during the consolidation. A failure to hold above this level often signals a deeper retracement is underway.
38.2% Level ($18.95): Widely regarded as a shallow, yet significant, retracement level. The stock's interaction with $18.95 served as a confirmation that the pullback from the resistance was gaining momentum.
50.0% Level ($17.47): The halfway point of the prior move is a classic level for market indecision. A breach below this level, as witnessed, shifted the near-term bias to the downside, targeting the deeper Fibonacci supports.
61.8% Level ($15.99): Known as the "Golden Ratio," this is one of the most critical Fibonacci levels. It represents a deep retracement that often holds in healthy pullbacks. The fact that the price has already tested and moved through this level indicates that the sell-off has brought the stock into a deeply oversold territory relative to its prior swing.
3. Primary Investment Opportunity & Strategic Outlook:
The convergence of the strong horizontal support at $14.00 and the completion of a deep Fibonacci retracement sequence creates a high-probability investment zone. With the key Fibonacci levels (23.6% to 61.8%) now in the rearview mirror, the focus shifts squarely to the ultimate support at $14.00.
This level represents the optimal area for strategic accumulation. A successful bounce from this zone would not only reaffirm the long-term support structure but also potentially initiate a new upward leg back towards the upper end of the trading range, targeting the $18.95 (38.2% Fib) and ultimately the $24.00 resistance level.
In conclusion, the technical evidence suggestsOSCR is forging a solid base. While the path of least resistance has been downward within the range, the stock is approaching a critical juncture where risk and reward become highly favorable. A disciplined approach would be to target entry points as the price approaches the strong $14.00 support, with a clear invalidation point should that level fail to hold.
Oscar Health, Inc. (
Detailed Technical Breakdown:
1. Established Trading Range:
The stock has entered a phase of equilibrium, characterized by a clear consolidation pattern. The boundaries of this pattern are distinct:
Upper Resistance: The $24.00 level has proven to be a significant technical and psychological barrier. On multiple attempts, the stock has been rejected from this zone, establishing it as a key ceiling for the current trend.
Lower Support: Conversely, the $14.00 level has acted as a robust floor. Each time the stock has declined to this region, buying interest has emerged, preventing a further breakdown and solidifying its role as a primary support level.
This consolidation between $14 and $24 indicates a battle between buyers and sellers, with neither side able to assert dominance. Such phases often precede a significant breakout once the market reaches a consensus.
2. Critical Fibonacci Retracement Analysis:
Applying Fibonacci retracement levels to a relevant prior price swing provides a mathematical framework for identifying potential reversal zones. The recent price action has interacted precisely with these key levels, validating their importance:
23.6% Level ($20.78): This level initially acted as a minor resistance point during the consolidation. A failure to hold above this level often signals a deeper retracement is underway.
38.2% Level ($18.95): Widely regarded as a shallow, yet significant, retracement level. The stock's interaction with $18.95 served as a confirmation that the pullback from the resistance was gaining momentum.
50.0% Level ($17.47): The halfway point of the prior move is a classic level for market indecision. A breach below this level, as witnessed, shifted the near-term bias to the downside, targeting the deeper Fibonacci supports.
61.8% Level ($15.99): Known as the "Golden Ratio," this is one of the most critical Fibonacci levels. It represents a deep retracement that often holds in healthy pullbacks. The fact that the price has already tested and moved through this level indicates that the sell-off has brought the stock into a deeply oversold territory relative to its prior swing.
3. Primary Investment Opportunity & Strategic Outlook:
The convergence of the strong horizontal support at $14.00 and the completion of a deep Fibonacci retracement sequence creates a high-probability investment zone. With the key Fibonacci levels (23.6% to 61.8%) now in the rearview mirror, the focus shifts squarely to the ultimate support at $14.00.
This level represents the optimal area for strategic accumulation. A successful bounce from this zone would not only reaffirm the long-term support structure but also potentially initiate a new upward leg back towards the upper end of the trading range, targeting the $18.95 (38.2% Fib) and ultimately the $24.00 resistance level.
In conclusion, the technical evidence suggests
Disclaimer
The information and publications are not meant to be, and do not constitute, financial, investment, trading, or other types of advice or recommendations supplied or endorsed by TradingView. Read more in the Terms of Use.
Disclaimer
The information and publications are not meant to be, and do not constitute, financial, investment, trading, or other types of advice or recommendations supplied or endorsed by TradingView. Read more in the Terms of Use.