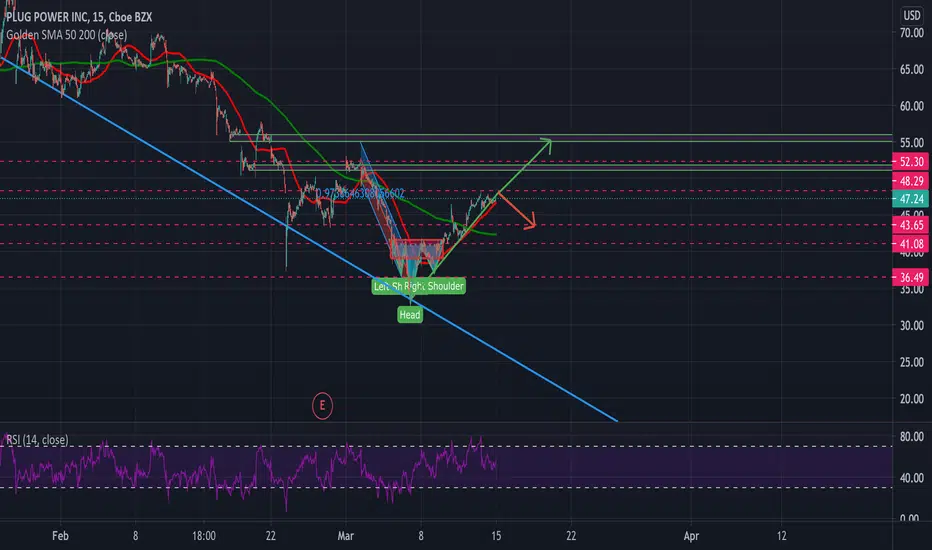
After a long regression, PLUG seems to have found its bottom after falling 40% from its 52-week high ending the regression with an inverse head and shoulders. Bollinger Bands are squeezing on its 6-month chart along with what looks like an impending MACD cross. PLUG needs to break the FIB resistance levels charted which seems relatively likely as long as the broader market doesn't experience a pullback as 10-year treasury yields have been fluctuating. PT1- $51.81, PT2- $56.19
Has strong top resistance at the $69-70 level
Has strong top resistance at the $69-70 level
Disclaimer
The information and publications are not meant to be, and do not constitute, financial, investment, trading, or other types of advice or recommendations supplied or endorsed by TradingView. Read more in the Terms of Use.
Disclaimer
The information and publications are not meant to be, and do not constitute, financial, investment, trading, or other types of advice or recommendations supplied or endorsed by TradingView. Read more in the Terms of Use.