JACKPOTKotakbank Fut is on the verge of breaking out of inverted head & shoulder pattern on DAILY charts with decent OI addition.
Risk:Reward = 1:2
Conditionally buy above 1812 with menioned stoploss & target.
Inverse Head and Shoulders

Is trying and is going to make itPrice has tried many tome to break that resistance. Eventually is going to make it. Also looks liken an inverse HS. I opened a long position. Is a very volatile stock so hang tight. SL triggers is a daily candle closes at the level shown. But it has to close.

$BTC #Bitcoin Just Gonna Leave This Here (Hmmmm..Maybe?) 😝This is just adding onto my logarithmic regression-inversion theory and how I personally believe the $BTC price movements may specifically play out. The general theory is that the logarithmic regression of $BTC will invert at a certain point in the next 1-3 years, changing the price suppression $BTC has had for its whole life into exponential support. I personally believe this is very possible, with exponential adoption of #Bitcoin for things like sovereign wealth funds, countries' legal tender and possibly even a world reserve asset. If those things (plus other possible variables) occur then this is how I see that possibly playing out.
Here is a detailed explanation of what I personally believe is happening/going to happen here.
Phase 1:
There would be a breakdown of price like we have now (possibly) completed. This would be in order to accomplish a few things for global institutions. Some of those things are:
1) Get Bitcoin out of the hands of the "common man". It would not be possible to acquire the amount of $BTC needed with so many people holding.
2) Cause liquidity issues for exchanges, making it more difficult for just anyone to purchase. (We have already seen this. ex: Voyager, Celsius, etc.)
3)Allow large accounts to be created at more feasible prices, while also providing a good (high) enough entry price to sustain value for the overall asset in the eyes of the public. (To keep people from losing interest)
There are obviously more reasons, but that's another post.
Phase 2:
A relief rally back up to the median range. This will obviously be a very volatile range, as 50% of investors sell (expecting a sharp move downward) and others (possibly the central financial institutions and/or sovereign wealth funds, who will not initially disclose their acquisitions) accumulating within this range.
Because of this volatility, the likely range it will be in, the immediate supports/resistances, and the typical movement of the $BTC price; My current prediction is that $BTC will move upward, after flipping the top of the recent range into support, and break above the main down-trend of a massive flag that $BTC has been forming for over a year. Then after a retest of that upper trend, price will attempt to break the new-found resistance as traders long from that trend line. Believing that this is the last upward movement, traders will then short the resistance level, and other holders may sell out of fear (or just simply because they will be at a break-even price, since a lot of volume was transacted in that range). This range will then prove to be the median range, previously mentioned. $BTC will then make a lower low, again at the upper trend of the flag. This will seem like a "bear-signal" but will actually be a second confirmation of support off of the upper-resistance trend of the flag, which will "fake-out" traders, causing a short squeeze. Then more traders will continue to short as others switch to a long stance. All of these movements will print an inverse-head-and-shoulders, the break-out of which will give $BTC price the momentum needed to make it back up to the $60K-$70K range.
Phase 3:
After making it back to the "all-time-high" range, there will undoubtedly be heavy volatility, as some call for a triple-top and others "FOMO" into #Bitcoin. This volatility, bouncing between the upper regression curve and the inversion curve, will begin to print a "rising-wedge" pattern. The break-out of this wedge will be the ultimate inversion of regression into exponential growth.
This is all pure speculation, however it is based on both, strong fundamental data as well as technical data. I personally believe in this theory, and it could also play out in other ways, but this scenario seems to make the most sense to me at the moment.
**This is my own opinion based on data observed. This is not financial advice.**

Nifty - Inverse Head & Shoulder breakout The target could be calculated based on the depth of the head and that is giving us the number around 25500.
Given the current momentum after the breakaway, market is starting to tell the bullish story.
Keep an eye in coming day.

BNB/USDT: Weekly Breakout! Massive Rally Ahead – Are You Ready?🚀 Hey everyone! 👋
If you’re finding value in this analysis, don’t forget to smash that 👍 and hit follow for premium setups that actually deliver results! 💹
🔍 Technical Breakdown:
BNB is looking primed for a massive rally! 💥 Breaking out of a textbook inverse head and shoulders pattern on the weekly time frame, BNB is flashing a strong bullish signal. The retest looks solid, and the setup suggests significant upside potential from here. 🟢
📈 Entry Range: $675-$735
🎯 Targets:
1️⃣ $980
2️⃣ $1,370
3️⃣ $1,660
4️⃣ $2,280
❌ Stop Loss: $480
⚖️ Leverage: Use low leverage for a safer trade (max 5x).
💬 What’s your take on BNB’s breakout potential? Are you spotting the same bullish momentum, or do you see it playing out differently? Let’s discuss in the comments below! Share your thoughts and analysis, and let’s make the most of this opportunity together. 🚀💰

Ankr’s breakout target from invh&s can bring 95% gains if soonAnkr is very close to completing its right shoulder on this fairly thicc inverse head and shoulders pattern it has formed. Hard to tell exactly when it will breach the neckline but one would assume that it’s probable for it to happen soon. *not financial advice*

XDC beginning to head to its bullish breakout targetsPosting an update this chart so I can show a zoomed in look at the daily price action with the measured move lines readjusted to the exact breakout points of the two chart patterns to provide ore accurate breakout targets. I will link the original chart idea i posted of these 2 patterns below. *not financial advice*

MSTR - Inverse H&S Pattern with Clear Breakout TargetThis is an Inverse Head and Shoulders pattern on MSTR 1-hour
Risk/Reward Analysis:
Entry Price: $440
Stop Loss: $400
Target Price: $520
Risk/Reward Ratio: 1R:2R
Details
Clear neckline breakout level around $440
Downside risk zone marked in red (-$40 from entry)
Upside potential marked in green (+$80 from entry)
The setup presents a favorable technical structure with a strong risk-reward ratio above 1:2.

CRV appears to breaking up from double bottom necklineIf you zoom in you can see the previous daily candle closed on the neckline with exact body support and now the current candle is having a nice bullish impulse, which suggests that it could validate the double bottom relatively soon. If it has a few days of correction n this zone it will also form a right shoulder to an inv h&s pattern that would then materialize with a neckline slightly above this double bottom neckline as I hypothesized my previous curve idea which I will provide a link to below. That inv h&s pattern would then have a slightly higher breakout target than this double bottom will should it materialize. For now the double bottom is the one to focus on as it seems very close to validating. Curve is likely overextended at this point so it could easily go back and forth on the neckline here before the real lift off. *not financial advice*

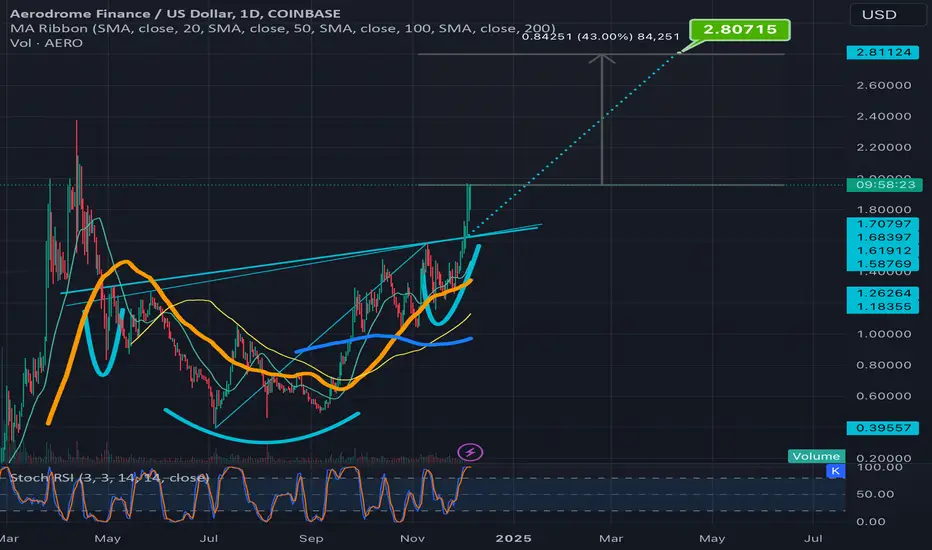
Aerousd breaking upwards from ascending inverse head & shouldersStill has about 41 percent of gains left to make between here and its full breakout targer. Will net a new all time high in the process. Not sure where it will go from there. could always overshoot or undershoot the target as well but most alts lately have been either hitting the target precisely or overshooting then. I like this particular unconventional inverse head and shoulders because it has 2 necklines both with the same breakout target. *not financial advice*
NEAR breaking up from invh&s and soon from symmetrical triangleIn order to reach the full inverse head and shoulder breakout target, NEAR will have to send price action well above the top trendline of this turquoise symmetrical triangle, in the process likely validating the breakout of that pattern too. *not financial advice*

Waves in a sleepy head inverse head & shoulders patternOnce price action wakes up the sleepy head pattern it can rise to $4.60 which is like a 10% gain from here if it were to hit the full breakout target. *not financial advice*

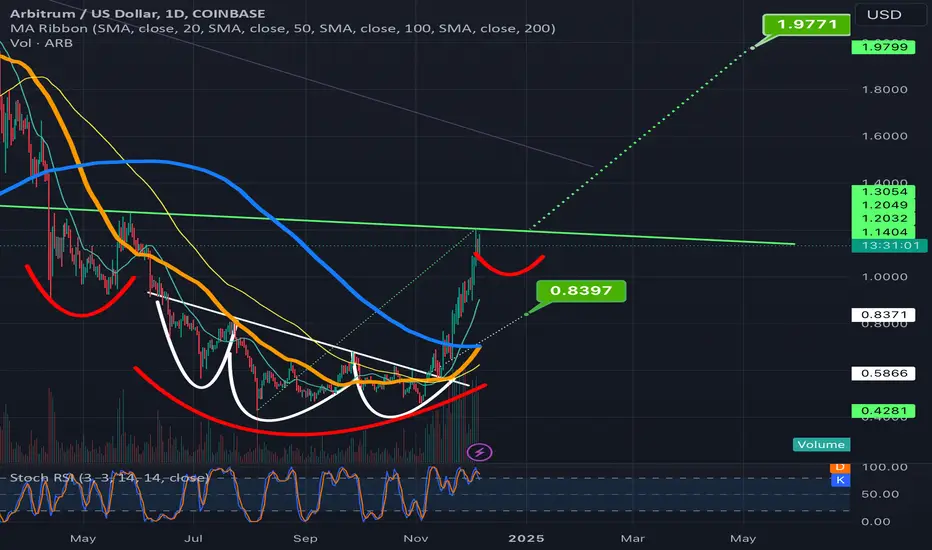
Arbitrum set to goldencross on next daily candle; invh&s in playWe can see after triggering the breakout of the smaller inverse head and shoulders and blowing past that target arbitrum has reached the perfect level that will cause this new inverse head and shoulders to materialize by correcting here and forming a right shoulder. We can also see that Arbitrum is just 1 day away from having it’s daily golden cross and considering many inverse head and boulder patterns in the altcoin market lately have been forming remarkably tiny right shoulders, Arbitrum also could follow suit and break up from the inverse head and shoulder neckline far sooner than you would normally ever expect these kind of patterns to do so. Also a chance it could form a normal shoulder here as well we wll know soon enough *not financial advice*
Dash filling out right shoulder after burj khaifa moveBy correcting here after dash’s big golden cross vertical slingshot in price action it is in the perfect zone to form a right shoulder to a newly materializing inverse head and shoulders pattern. The common theme for many inverse head and shoulders patterns this alt season has been very tiny right shoulders so there’s a decent chance it breaks above the neckline of the inverse head and shoulders before where the hypothetical right shoulder I have drawn on the chart reached it’s end. Always a chance it bucks the trend and ends up being even wider than what I drew too as the width of the shoulder would traditionally be. We will know soon enough As always dash and zcash see to be having some similar chart patterns. Nice to see privacy coins still matter enough to have a chance to make big gains this bull run and perhaps even surpass the previous all time highs if it keeps this up long enough *not financial advice*

Zcash working on filling out right shoulder for next breakout Zcash appears to be forming a special inverse head and shoulders pattern I like to refer to as the sweet dreams or sleepy head inverse head and shoulders as the trendline you draw to highlight the head and shoulders take on a smile face with its eyelids closed. I anticipate even though I already drew the hypothetical length of the right shoulder fairly s that there’s a chance it could break above the neckline after forming an even shorter right shoulder based on some of the recent tiny right shoulders we’ve seen fro the likes of digibyte, atom, cardano and others. Always a chance since it’s left shoulder was tiny that the right one could buck the trend and form a regular sized right shoulder too, either way I’m confident with market conditions how they currently are theat probability favors this pattern breaking out and up eventually. *not financial advce*

Freshly goldencrossed Fetch heading towards inverse h&s targetGoldencross just occurred and so far fetch is responding with a green candle. It has been slowly climbing up its inverse head and shoulder measured move line but we could see it do something similar here to how Render reacted recently. I expect price to hit both of these targets in the near future *Not financial advice*

Freshly goldencrossed Fetch heading towards inverse h&s targetGoldencross just occurred and so far fetch is responding with a green candle. It has been slowly climbing up its inverse head and shoulder measured move line but we could see it do something similar here to how Render reacted recently. I expect price to hit both of these targets in the near future *Not financial advice*

Storj can make 74% gains just by reaching this invh&s targetStorj looks very close to completing the right shoulder of this inverse head and shoulders pattern here. 74% gains off one pattern s nothing to sneeze at. *not financial advice*

Atomusd at the goldencross starting lineIn a very similar inverse head and shoulders that digibyte jsut successfully broke out of with the same kind of little right shoulder. For now there’s been no confirmation of a breakout or even solidified support on the neckline just yet so price could easily dip back below the neckline here, however considering the golden cross has occurred it wouldn’t surprise me if the neckline is confirmed solidified support n quick order. *not financial advce*

CRV built a burj khaifa on its goldencrossCRV easily could just keep going parabolically vertical here but this would also be a very nice place to catch its breath and attempt to complete the right shoulder to an inv h&s pattern. Just in case I will be watching this trendline to see if it can break above it in the next few candles or not *not financial advice*

Digibyte looks like it’s validating the invh&s breakoutDigibyte shown here on the daily chart showing a nice bullish impulse firmly above the neckline of its inverse head and shoulders pattern. Already well on the way to the breakout target here so very likely validating the breakout. Also doing so a day or so before it has its golden cross. Once it reaches the full breakout target it’s likely to test the next potential resistance of the yellow horizontal trendline. That trendline is actually the neckline of a larger double bottom pattern. Wouldn’t be surprised with the golden cross so close by that whatever resistance that double bottom neckline provides doesn’t last very long *not financiala dvice*

Qnt forming right shoulder on invh&s while retsting channel ttl I’m hoping the right shoulder quant is now forming here by retracing after reaching that top purple horizontal line, will be a very short shoulder with help from it’s recent golden cross and hopefully the support from the top trendline of the yellow channel that quant just recently broke above. Usually a right shoulder would last for a much longer period of time than I have drawn this one to last in order to be ore proportional with the left shoulder(not shown here), however loopring and a few other charts recently have had very small asymmetric right shoulders on the inverse head and shoulders patterns that their price broke upward from so that may also be the case for quant’s right shoulder as well. We will see soon enough, if Quant is to follow suit with the rest of the altcoin market it’s recent golden cross should give it the bullish momentum it needs to complete this right shoulder as a very small shoulder indeed.

If Link corrects long enough here a new inv h&s will be in playCurrently after yesterday’s fantastic green pump candle on Link, the new daily candle s currently red as link takes a quick breather. Now this could only last a very short time but if t lasts for a few daily candles, that will be enough to qualify the current correction as a right shoulder to what will then be this newly formed inverse head and shoulders pattern. If it starts pumping again on the current daily candle and goes above the neckline and keeps continuing up we can disregard this as of now strictly hypothetical & speculative inverse head and shoulders pattern, but while there’s still a chance I thought it would be fun to post this chart and draw a rather arbitrary curve for the length of a potential right shoulder. Link has already broken out of a Bull flag on the higher timeframe charts (which I will post a link of below) and that flag has a target of around $55 so odds are good whether this potential new inverse head and shoulders pattern comes to be valid or not that we will still end up hitting its breakout target of $47.18 on our way up to reach the $55 target of the macro bullflag, if we are lucky though link will correct and for a right shoulder here though and then I will be able to enter a position a little lower than this to get the opportunity for even higher percentage gains once it reaches the full target of both this pattern and the macro bull flag’s full target at $55. *not financial advice*
