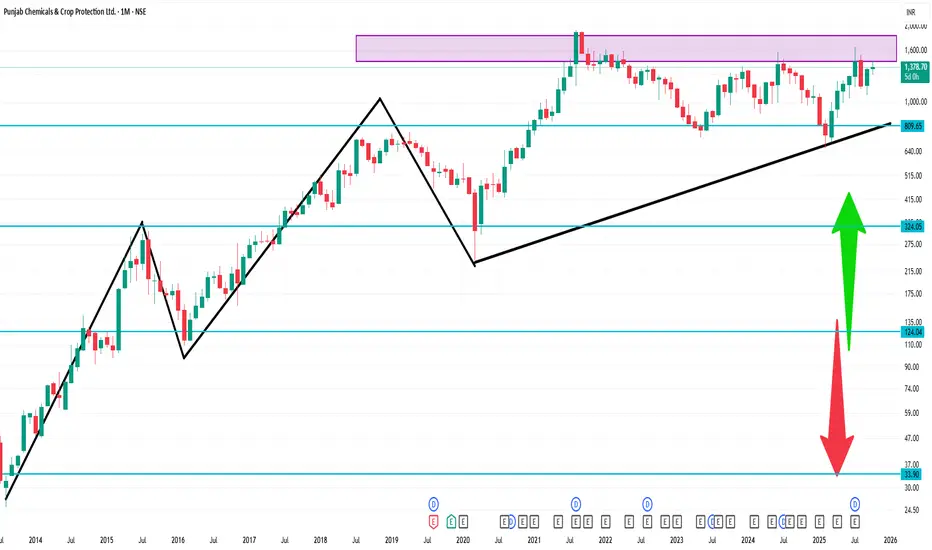
📈 1-Month Price Range (September 24 – October 24, 2025)
High: ₹1,407.50 on October 17
Low: ₹1,320.30 on October 14
Closing on October 24: ₹1,378.70
📊 Summary
Over the past month, PUNJABCHEM has experienced a decline, trading within a range of ₹1,320.30 to ₹1,407.50. Technical indicators suggest a bearish trend, with the stock trading below key moving averages and a negative MACD. However, the low RSI indicates potential for a rebound if buying interest returns.
Related publications
Disclaimer
The information and publications are not meant to be, and do not constitute, financial, investment, trading, or other types of advice or recommendations supplied or endorsed by TradingView. Read more in the Terms of Use.
Related publications
Disclaimer
The information and publications are not meant to be, and do not constitute, financial, investment, trading, or other types of advice or recommendations supplied or endorsed by TradingView. Read more in the Terms of Use.