QCOM: Exploring Potential 30% Upside in AI Chip Contender Amid Data Center Expansion – SWOT and Intrinsic Value Insights
📊 Introduction
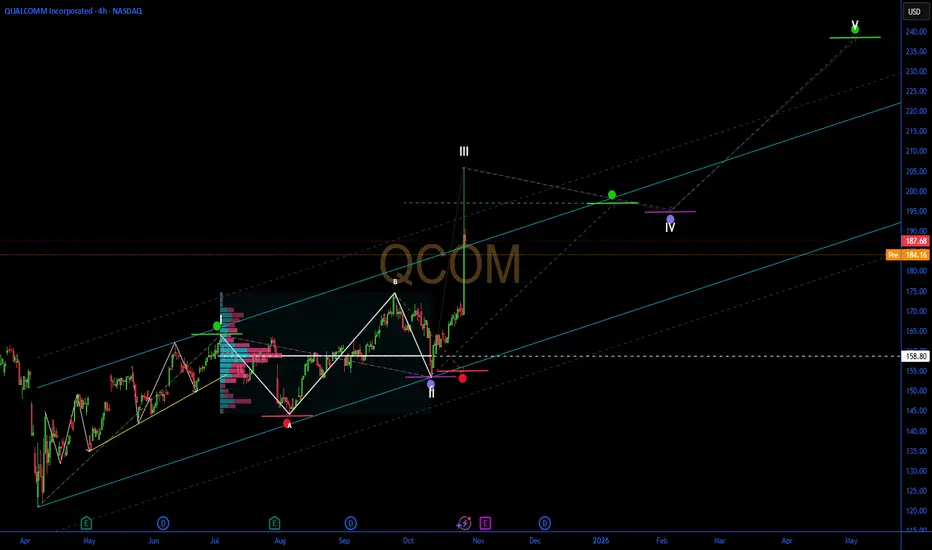
As of October 28, 2025, QUALCOMM Incorporated (QCOM) is experiencing post-announcement volatility following an 11% surge in the prior session, trading around $185 in pre-market after closing at $187.68. This movement stems from the launch of new AI accelerator chips aimed at competing in data centers, amid a broader tech rally driven by $500B in projected AI infrastructure spending and Fed rate stability at 4.75%. Sector dynamics reflect intensified competition in semiconductors, with NVIDIA and AMD also advancing, though macroeconomic factors like easing U.S.-China trade talks support chip demand, countered by ongoing export restrictions and supply chain inflation.
🔍 SWOT Analysis
**Strengths 💪**: Qualcomm holds a commanding position in mobile chipsets with over 40% market share, bolstered by TTM revenue of $43.26B and net income of $11.57B. Robust financials include a 44.62% return on equity and quarterly revenue growth of 10.30% yoy, driven by diversified segments like automotive (up 20% yoy). Low beta of 1.23 indicates relative stability, with partnerships in 5G and IoT enhancing ecosystem strength.
**Weaknesses ⚠️**: Debt-to-equity at 54.35% signals moderate leverage, potentially vulnerable in high-interest environments. Dependence on China for ~60% of revenue exposes risks from geopolitical tensions, while R&D costs (22% of revenue) could strain margins if AI adoption slows. Historical patent disputes add to operational challenges.
**Opportunities 🌟**: The AI data center push, with new chips targeting inference markets, aligns with a $200B+ opportunity by 2027, per industry forecasts. Growth in edge AI and automotive semiconductors, backed by analyst EPS projections rising to $12.10 for 2026, supports valuation re-rating. Expansion into PCs and servers via Snapdragon platforms could capture 15-20% share from Intel.
**Threats 🚩**: Fierce competition from NVIDIA's Blackwell and AMD's MI series threatens market erosion, with potential antitrust probes in the EU. Regulatory hurdles, such as U.S. export bans impacting 15-20% of sales, and broader sector volatility from tariff risks pose downside. Economic slowdowns may defer enterprise capex.
💰 Intrinsic Value Calculation
Applying a value investing method for tech stocks, we calculate intrinsic value using a weighted blend of book value and earnings multiples, with a 20% margin of safety for cyclical risks. Inputs from filings: Book value per share $25.10, TTM EPS $10.36, assumed growth rate 10% (blending current 16.37% and next-year 1.71% projections).
Formula: Intrinsic Value = (Book Value per Share * Weight) + (EPS * Growth Multiplier)
- Weight for book value: 0.3 (asset-intensive adjustments)
- Growth Multiplier: 28.5 (Graham-inspired: 8.5 + 2*10)
Calculation:
(25.10 * 0.3) + (10.36 * 28.5) = 7.53 + 295.26 = 302.79
Apply 20% margin of safety: 302.79 * 0.8 ≈ $242.23
At current price ~$185, QCOM appears undervalued by ~24-31% (upside to $242 fair value, aligned with forward P/E of 13.95 and comparables). Debt flags are minor at 54%, with sustainability tied to EPS growth above 10%. 📈 Undervalued.
📈 Entry Strategy Insights
Institutional methods target support zones near $180-182 (near 50-day SMA) for unleveraged, long-term entries using dollar-cost averaging (DCA). Scale in on 4-7% dips, employing non-repainting volume-based signals to verify momentum shifts. Effective for 10-15% position accumulation over 2-4 months, with breakout targets above $190 for phased exits. 🚀 Spot zones.
⚠️ Risk Management
Restrict sizing to 1-5% of portfolio to handle sector swings, diversifying across tech subsectors and defensives. Use trailing stops 7-10% below entry (e.g., $170) and favor long-term holds if ROE sustains, monitoring earnings reports and trade policy. Caution on 10-20% drawdowns from competitive news.
🔚 Conclusion
Qualcomm's AI diversification, solid fundamentals, and undervalued profile amid tech momentum indicate potential to $242+, with safety buffers. Key takeaways: Track AI adoption for earnings uplift, independently validate growth estimates.
This is educational content only; not financial advice. Always conduct your own due diligence.
📊 Introduction
As of October 28, 2025, QUALCOMM Incorporated (QCOM) is experiencing post-announcement volatility following an 11% surge in the prior session, trading around $185 in pre-market after closing at $187.68. This movement stems from the launch of new AI accelerator chips aimed at competing in data centers, amid a broader tech rally driven by $500B in projected AI infrastructure spending and Fed rate stability at 4.75%. Sector dynamics reflect intensified competition in semiconductors, with NVIDIA and AMD also advancing, though macroeconomic factors like easing U.S.-China trade talks support chip demand, countered by ongoing export restrictions and supply chain inflation.
🔍 SWOT Analysis
**Strengths 💪**: Qualcomm holds a commanding position in mobile chipsets with over 40% market share, bolstered by TTM revenue of $43.26B and net income of $11.57B. Robust financials include a 44.62% return on equity and quarterly revenue growth of 10.30% yoy, driven by diversified segments like automotive (up 20% yoy). Low beta of 1.23 indicates relative stability, with partnerships in 5G and IoT enhancing ecosystem strength.
**Weaknesses ⚠️**: Debt-to-equity at 54.35% signals moderate leverage, potentially vulnerable in high-interest environments. Dependence on China for ~60% of revenue exposes risks from geopolitical tensions, while R&D costs (22% of revenue) could strain margins if AI adoption slows. Historical patent disputes add to operational challenges.
**Opportunities 🌟**: The AI data center push, with new chips targeting inference markets, aligns with a $200B+ opportunity by 2027, per industry forecasts. Growth in edge AI and automotive semiconductors, backed by analyst EPS projections rising to $12.10 for 2026, supports valuation re-rating. Expansion into PCs and servers via Snapdragon platforms could capture 15-20% share from Intel.
**Threats 🚩**: Fierce competition from NVIDIA's Blackwell and AMD's MI series threatens market erosion, with potential antitrust probes in the EU. Regulatory hurdles, such as U.S. export bans impacting 15-20% of sales, and broader sector volatility from tariff risks pose downside. Economic slowdowns may defer enterprise capex.
💰 Intrinsic Value Calculation
Applying a value investing method for tech stocks, we calculate intrinsic value using a weighted blend of book value and earnings multiples, with a 20% margin of safety for cyclical risks. Inputs from filings: Book value per share $25.10, TTM EPS $10.36, assumed growth rate 10% (blending current 16.37% and next-year 1.71% projections).
Formula: Intrinsic Value = (Book Value per Share * Weight) + (EPS * Growth Multiplier)
- Weight for book value: 0.3 (asset-intensive adjustments)
- Growth Multiplier: 28.5 (Graham-inspired: 8.5 + 2*10)
Calculation:
(25.10 * 0.3) + (10.36 * 28.5) = 7.53 + 295.26 = 302.79
Apply 20% margin of safety: 302.79 * 0.8 ≈ $242.23
At current price ~$185, QCOM appears undervalued by ~24-31% (upside to $242 fair value, aligned with forward P/E of 13.95 and comparables). Debt flags are minor at 54%, with sustainability tied to EPS growth above 10%. 📈 Undervalued.
📈 Entry Strategy Insights
Institutional methods target support zones near $180-182 (near 50-day SMA) for unleveraged, long-term entries using dollar-cost averaging (DCA). Scale in on 4-7% dips, employing non-repainting volume-based signals to verify momentum shifts. Effective for 10-15% position accumulation over 2-4 months, with breakout targets above $190 for phased exits. 🚀 Spot zones.
⚠️ Risk Management
Restrict sizing to 1-5% of portfolio to handle sector swings, diversifying across tech subsectors and defensives. Use trailing stops 7-10% below entry (e.g., $170) and favor long-term holds if ROE sustains, monitoring earnings reports and trade policy. Caution on 10-20% drawdowns from competitive news.
🔚 Conclusion
Qualcomm's AI diversification, solid fundamentals, and undervalued profile amid tech momentum indicate potential to $242+, with safety buffers. Key takeaways: Track AI adoption for earnings uplift, independently validate growth estimates.
This is educational content only; not financial advice. Always conduct your own due diligence.
⚡️ Request a trial or subscribe to our premium🛠️tools at ➡️DCAlpha.net
All scripts & content provided by DCAChampion are for informational & educational purposes only.
All scripts & content provided by DCAChampion are for informational & educational purposes only.
Disclaimer
The information and publications are not meant to be, and do not constitute, financial, investment, trading, or other types of advice or recommendations supplied or endorsed by TradingView. Read more in the Terms of Use.