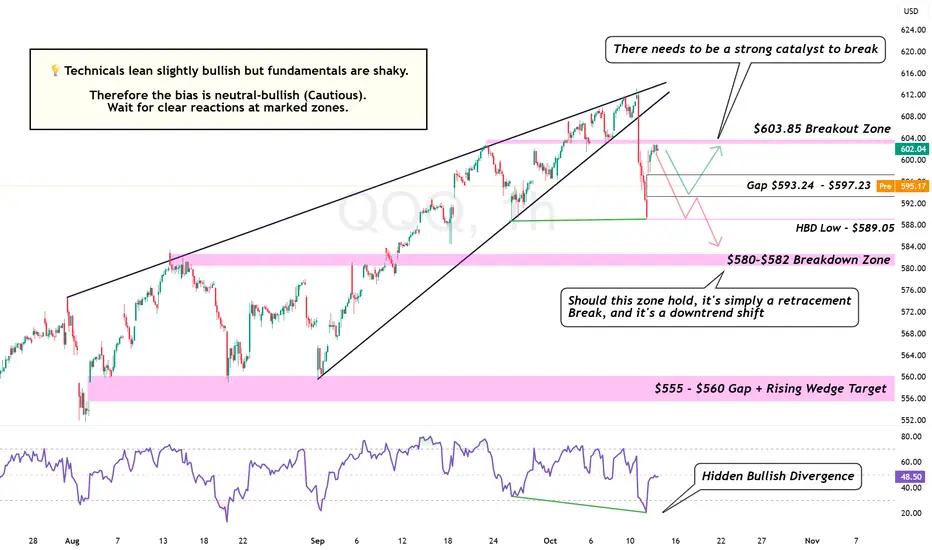
QQQ is gapping down right into a massive technical test: the $593 Gap Support.
This is not a regular drop. Our chart is showing a rare conflict:
The bias right now is neutral-bullish — cautious optimism.
If bulls hold the gap, expect a short-term rebound toward $603–$605 where sellers will likely re-emerge.
But if $593 gives way, this turns into a full-on correction targeting $582 → $560, completing the wedge breakdown target.
Key Levels:
Bias: 🟡 Neutral-Bullish (Cautious)
Timeframe: 1H
Indicators: RSI Hidden Bullish Divergence, Rising Wedge Breakdown
This is not a regular drop. Our chart is showing a rare conflict:
- Bullish Setup: A Hidden Bullish Divergence (HBD) is screaming for a bounce.
- Bearish Risk: A loss of the low could trigger a rapid descent to the $580 Zone.
The bias right now is neutral-bullish — cautious optimism.
If bulls hold the gap, expect a short-term rebound toward $603–$605 where sellers will likely re-emerge.
But if $593 gives way, this turns into a full-on correction targeting $582 → $560, completing the wedge breakdown target.
This is the moment of truth.
Bulls need to defend $593 or risk a complete sentiment shift.
Key Levels:
- $603.85 — Breakout Zone
- $593.24–$597.23 — Gap Support
- $589.05 — Structural Floor
- $580–$582 — Breakdown Zone
- $555–$560 — Rising Wedge Target
Bias: 🟡 Neutral-Bullish (Cautious)
Timeframe: 1H
Indicators: RSI Hidden Bullish Divergence, Rising Wedge Breakdown
Trading leveraged products carries a high level of risk and may result in losses exceeding your initial investment; ensure you fully understand the risks involved.
-
Use your TradingView charts to trade your Alchemy account: bit.ly/42vUfjL
-
Use your TradingView charts to trade your Alchemy account: bit.ly/42vUfjL
Disclaimer
The information and publications are not meant to be, and do not constitute, financial, investment, trading, or other types of advice or recommendations supplied or endorsed by TradingView. Read more in the Terms of Use.