Wave Structure Summary:
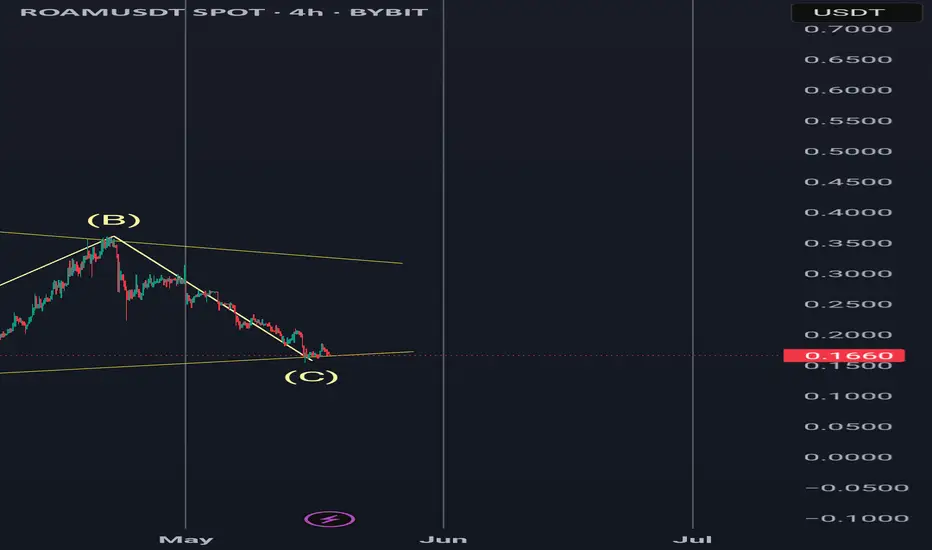
The chart shows a clear A-B-C corrective structure within a descending channel.
Wave A: Strong initial drop.
Wave B: Sharp corrective rally to the top of the channel.
Wave C: Currently in a 5-wave impulsive decline, potentially nearing completion at the lower boundary (~0.17 USDT).
The structure may also be interpreted as a W-X-Y complex correction under NeoWave principles.
Trading Scenarios:
Scenario 1 – Bullish Reversal (Wave C Complete):
Entry: 0.165 – 0.175 (after bullish candle confirmation).
Stop-Loss: Below 0.155.
Targets:
TP1: 0.22
TP2: 0.28
TP3: 0.35+ (if breakout confirms).
Scenario 2 – Bearish Continuation (Wave C Extends):
Entry: On 4H close below 0.155.
Stop-Loss: Above 0.17.
Targets:
TP1: 0.13
TP2: 0.10
Disclaimer
The information and publications are not meant to be, and do not constitute, financial, investment, trading, or other types of advice or recommendations supplied or endorsed by TradingView. Read more in the Terms of Use.
Disclaimer
The information and publications are not meant to be, and do not constitute, financial, investment, trading, or other types of advice or recommendations supplied or endorsed by TradingView. Read more in the Terms of Use.