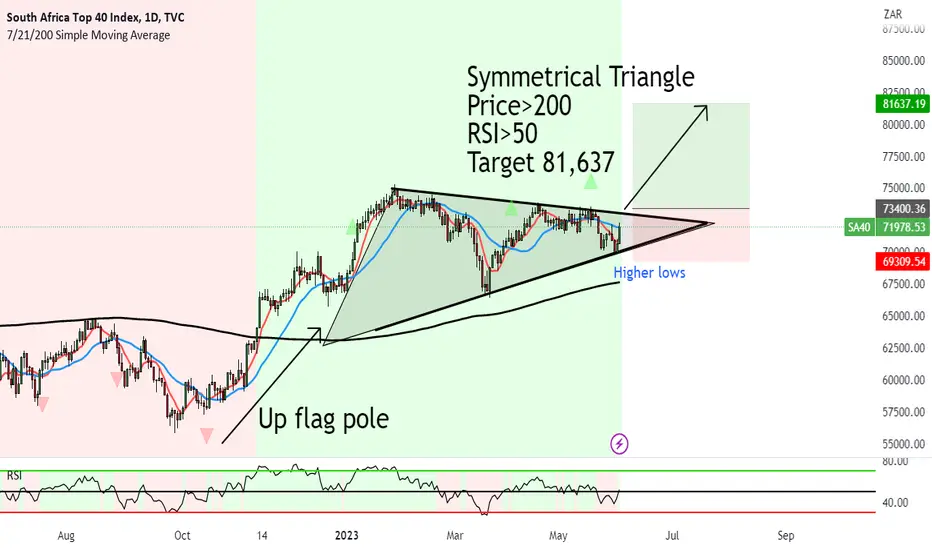
Symmetrical Triangle seems to be forming on the JSE ALSI 40.
This is where price constricts into a triangle that is not facing up or down.
We now need the price to break above the Apex, which will send the price higher.
The beauty about Symmetrical Triangles, is that they are generally continuation patterns to the prior trend.
With the up flag pole before the triangle confirmed, means we will expect a break up.
Price>200
RSI>50
Target 81,637
🌐NEW Website 2025:
mati-trader.lovable.app/
✅ Facebook:
facebook.com/groups/matitrader
𝕏 (Formerly Twitter):
twitter.com/timonr
Trade Well,
Timon Rossolimos
Founder, MATI Trader
(Pro trader since 2003)
mati-trader.lovable.app/
✅ Facebook:
facebook.com/groups/matitrader
𝕏 (Formerly Twitter):
twitter.com/timonr
Trade Well,
Timon Rossolimos
Founder, MATI Trader
(Pro trader since 2003)
Disclaimer
The information and publications are not meant to be, and do not constitute, financial, investment, trading, or other types of advice or recommendations supplied or endorsed by TradingView. Read more in the Terms of Use.