I have seldom written about one of my favorite stocks within the retails sector.  SFM has been a great momentum stock but on Aug 12th I highlighted that the stock is loosing momentum.
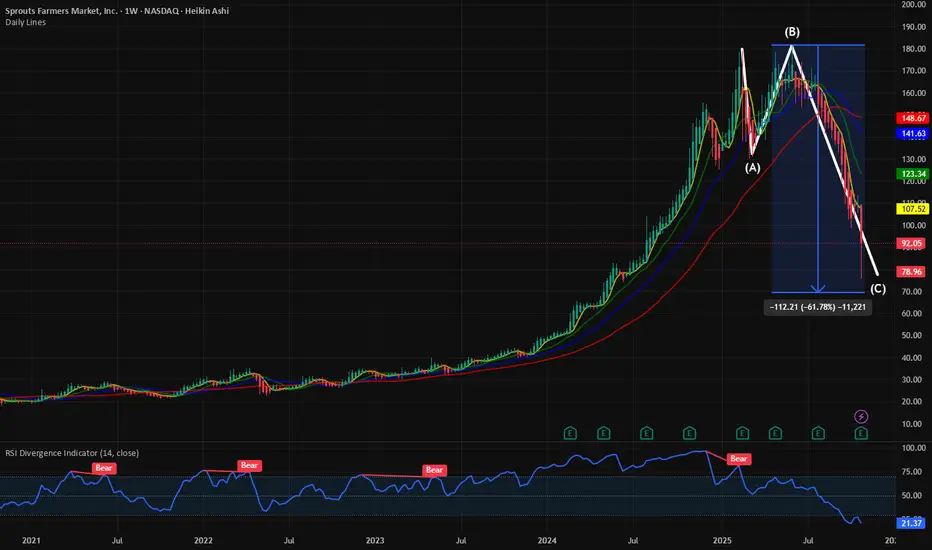
SFM vs XRT: SFM losses momentum. Underperforming XRT. for NASDAQ:SFM by RabishankarBiswal — TradingView
Since my last blog when the RSI was above 40, the stock has lost 50% of the value. Crrently the RSI is @ 20 and forming a double bottom on the charts. With such heavy correction on such a momentum stock it makes sense to look at the Eliot correction wave. Usually the 3rd wave is the longest in such corrective patterns. With the stock hovering around 75 $ it has almost corrected 60 %. The 0.618 Fib retracement level from the 52 week high is at 70 $.SFM has usually outperformed the  XRT and SPY over the last 5 years and still holding its outperformance.
Trade set up :SFM is in an accumulation pattern. Eliot correction pattern is nearing completion. Stock to bottom @ 70 $. Double bottom in RSI is bullish.
Since my last blog when the RSI was above 40, the stock has lost 50% of the value. Crrently the RSI is @ 20 and forming a double bottom on the charts. With such heavy correction on such a momentum stock it makes sense to look at the Eliot correction wave. Usually the 3rd wave is the longest in such corrective patterns. With the stock hovering around 75 $ it has almost corrected 60 %. The 0.618 Fib retracement level from the 52 week high is at 70 $.
Trade set up :
Related publications
Disclaimer
The information and publications are not meant to be, and do not constitute, financial, investment, trading, or other types of advice or recommendations supplied or endorsed by TradingView. Read more in the Terms of Use.
Related publications
Disclaimer
The information and publications are not meant to be, and do not constitute, financial, investment, trading, or other types of advice or recommendations supplied or endorsed by TradingView. Read more in the Terms of Use.