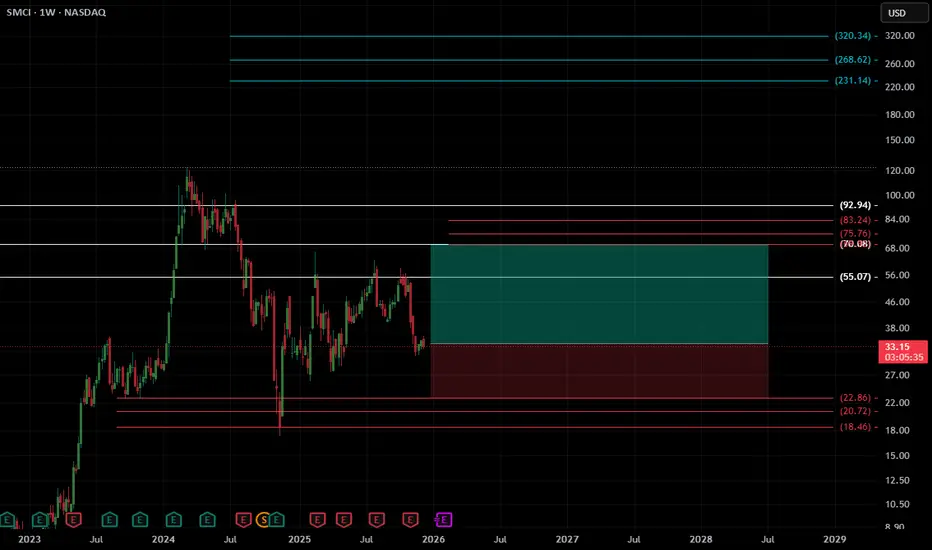
SMCI has pulled back into a key higher-timeframe demand zone, where price has shown repeated reactions and absorption of sell-side pressure. After a long corrective phase, the weekly chart is now forming a potential base, suggesting the possibility of a broader recovery leg toward overhead inefficiencies.
Price is currently sitting at CMP, right on top of a structural support cluster that has historically launched strong rallies. With volatility compressing and wicks showing buyer defense, SMCI may be preparing for a macro rebound.
🔹 Entry: CMP
🔹 Target (TP): 69.65
🔹 Stop-Loss (SL): 22.95 (stop adding money here and wait)
This setup targets a move back toward the major weekly imbalance above, aligning with prior distribution structure and unfilled liquidity. A weekly close above 55–56 would strengthen the bullish case, potentially accelerating the move into the 70+ zone.
A breakdown below 22.95 would invalidate the idea and imply continuation of the larger downtrend.
Trade Management
Partial profits can be taken as price approaches 55–56, the first significant weekly resistance.
Momentum confirmation: a strong weekly close above 56 opens room for continuation toward 70+.
Hard invalidation: Weekly close below 22.95.
⚠️ Financial Disclaimer :
Not financial advice. Just chart art. If you go long because the lines look optimistic, SMCI may choose violence instead. Always DYOR and protect your capital.
⚠️ Financial Disclaimer:
This post is not financial advice. I am not your financial advisor, your life coach, or your legally responsible adult.
Always do your own research and never trade based solely on internet comedy.
This post is not financial advice. I am not your financial advisor, your life coach, or your legally responsible adult.
Always do your own research and never trade based solely on internet comedy.
Disclaimer
The information and publications are not meant to be, and do not constitute, financial, investment, trading, or other types of advice or recommendations supplied or endorsed by TradingView. Read more in the Terms of Use.