hi traders
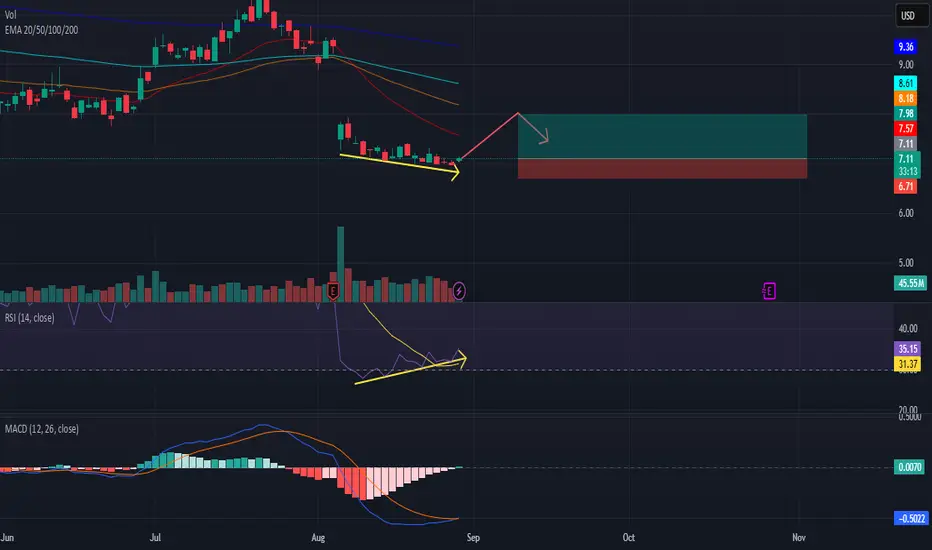
1. Snapchat (SNAP) has been in a downtrend recently, trading below its 20, 50, 100, and 200-day EMAs.
Price is currently around $7.11, below all major moving averages, which act as resistance.
The last earnings (red "E") saw a sharp gap down, which means sentiment is still cautious.
2. Volume
A big spike in volume occurred after earnings, followed by declining volume. This suggests the panic selling may have settled, and accumulation might be starting.
3. RSI (Relative Strength Index)
Current RSI is 35.15, slightly above oversold territory (30).
I spotted a bullish divergence: price made a lower low, while RSI held higher — this can hint at a possible reversal.
4. MACD (Moving Average Convergence Divergence)
MACD histogram is turning positive, and you’re right — the MACD line crossed above the signal line, which is a bullish sign.
However, it’s still below the zero line, meaning momentum is improving but not yet fully bullish.
5. Support & Resistance
Immediate support: around $6.70 – $7.00 (recent consolidation zone).
Resistance: $7.57 (20 EMA), then $8.18 (50 EMA), and major resistance around $9.36 (200 EMA).
🔎 Conclusion:
Short-term: There are indeed bullish reversal signals (RSI divergence + MACD crossover). This could lead to a bounce toward 8$
Medium-term: Trend is still bearish until SNAP can break above the 50-day EMA (~$8.18) with volume.
Risk: If it loses $6.70 support, it could revisit lower levels.
Anyway, I am buying now based on the bullish divergences on 1D and 4h time frames.
Good luck!
Trade closed: target reached
short term target reached. congratulations💥 Free signals and ideas ➡ t.me/vfinvestment
Disclaimer
The information and publications are not meant to be, and do not constitute, financial, investment, trading, or other types of advice or recommendations supplied or endorsed by TradingView. Read more in the Terms of Use.
💥 Free signals and ideas ➡ t.me/vfinvestment
Disclaimer
The information and publications are not meant to be, and do not constitute, financial, investment, trading, or other types of advice or recommendations supplied or endorsed by TradingView. Read more in the Terms of Use.