# USOIL Technical Analysis & Trading Strategy
* Current Position: 64.581 (August 23, 2025, 12:50 AM UTC+4)
---
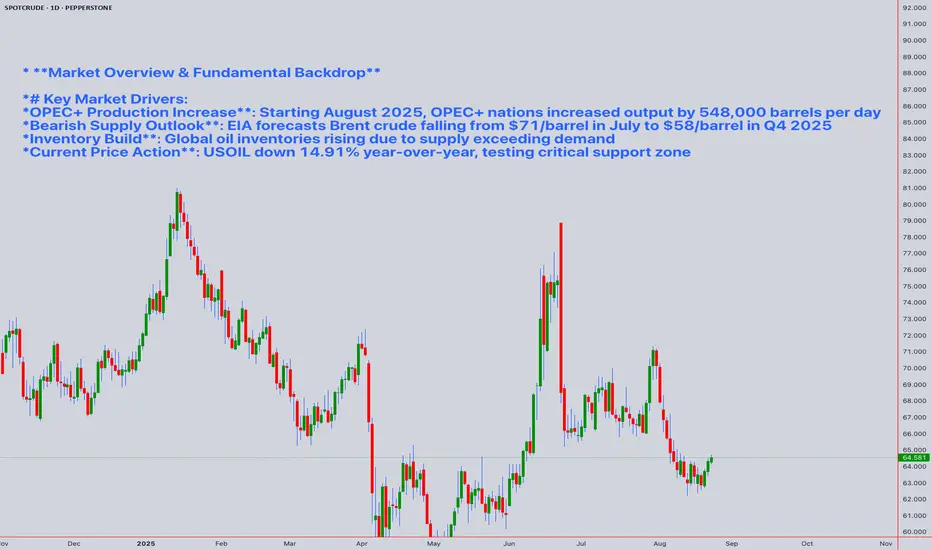
* **Market Overview & Fundamental Backdrop**
*# Key Market Drivers:
*OPEC+ Production Increase**: Starting August 2025, OPEC+ nations increased output by 548,000 barrels per day
*Bearish Supply Outlook**: EIA forecasts Brent crude falling from $71/barrel in July to $58/barrel in Q4 2025
*Inventory Build**: Global oil inventories rising due to supply exceeding demand
*Current Price Action**: USOIL down 14.91% year-over-year, testing critical support zone
---
* **Multi-Timeframe Technical Analysis**
*# **Monthly/Weekly (Swing Analysis)**
**Elliott Wave Analysis:**
- Currently in Wave C of a corrective ABC pattern from 2024 highs
- Major support confluence at 63.88-64.72 zone (previous significant lows)
- If support fails, next target: 58-60 range (EIA fundamental target alignment)
**Wyckoff Analysis:**
- Phase C of Distribution: Testing support after distribution top
- Volume analysis suggests institutional selling on rallies
- Support test at current levels critical for future direction
*# **Daily Timeframe**
**Harmonic Patterns:**
- Potential Bearish Bat pattern completion around 66-67 resistance
- AB=CD pattern suggests 62-63 as next measured target if support breaks
**Ichimoku Analysis:**
- Price below all major Ichimoku levels (bearish)
- Kumo (cloud) acting as resistance around 67-69
- Tenkan-sen/Kijun-sen bearish cross occurred
*# **4H/1H Analysis**
**Key Levels:**
*Resistance**: 66.50, 67.20, 68.00
*Support**: 64.00, 63.88, 62.50
**RSI Analysis:**
- 4H RSI: 35-40 range (oversold territory)
- Divergence watch: Any bullish divergence could signal temporary bounce
**Bollinger Bands:**
- Price at lower band, suggesting potential oversold bounce
- Squeeze pattern developing, indicating volatility expansion ahead
**VWAP Analysis:**
- Daily VWAP: 65.80 (price below - bearish)
- Weekly VWAP: 67.20 (strong resistance)
*# **Intraday (5M-30M) Analysis**
**Moving Averages:**
- 20 EMA: Acting as immediate resistance at 64.80
- 50 SMA: Dynamic resistance at 65.50
- 200 SMA: Key level at 67.00
**Gann Theory Application:**
*Square of 9**: Next support at 63.00 (significant Gann level)
*Time Cycles**: 14-21 day cycle suggests potential reversal zone by August 28-30
*Gann Angles**: 2x1 angle support at 63.50
*Price Squaring**: 64² = important mathematical support
---
* **Weekly Trading Strategy (August 26-30, 2025)**
*# **Monday, August 26**
**Setup**: Support Bounce Play
*Entry**: 64.20-64.40 (if holding above 63.88)
*Stop Loss**: 63.70
*Target 1**: 65.20
*Target 2**: 65.80
*Risk-Reward**: 1:2
*# **Tuesday, August 27**
**Setup**: Breakdown Play (if Monday support fails)
*Entry**: Break below 63.80 with volume
*Stop Loss**: 64.30
*Target 1**: 62.50
*Target 2**: 61.80
*Risk-Reward**: 1:2.5
*# **Wednesday, August 28**
**Setup**: Range Trade
*Long Entry**: 63.00-63.20
*Short Entry**: 65.50-65.80
*Range SL**: 50 pips
*Range Targets**: Opposite side of range
*# **Thursday, August 29**
**Setup**: Momentum Follow
*Bullish**: Above 65.80 with volume → Target 66.50
*Bearish**: Below 63.00 → Target 61.50
*Stop**: 40-50 pips from entry
*# **Friday, August 30**
**Setup**: Weekly Close Strategy
*Focus**: Position for next week based on weekly close
*Above 64.50**: Bullish bias for next week
*Below 63.50**: Bearish bias for next week
---
* **Risk Management Framework**
*# **Position Sizing**
- Maximum risk per trade: 2% of account
- Daily loss limit: 4% of account
- Weekly loss limit: 8% of account
*# **Market Hours Focus**
*Best Volatility**: 13:30-17:00 UTC (US session)
*Asian Session**: 01:00-08:00 UTC (lower volatility)
*Overlap Periods**: Highest volume and best setups
---
* **Geopolitical & Macro Scenarios**
*# **Bearish Catalysts**
1. **OPEC+ Further Production Increases**: Could push prices to $58-60 range
2. **US Strategic Reserve Releases**: Additional supply pressure
3. **China Economic Slowdown**: Reduced demand expectations
4. **Recession Fears**: Global demand destruction
*# **Bullish Catalysts**
1. **Middle East Tensions**: Any supply disruption risk
2. **OPEC+ Production Reversal**: If they halt planned increases
3. **Hurricane Season**: Potential Gulf of Mexico disruptions
4. **Geopolitical Tensions**: Russia-Ukraine, Iran tensions
*# **Probability Assessment**
*Bearish Scenario (60%)**: Break below 63.88 → Target 58-60
*Neutral Scenario (25%)**: Range-bound 63.50-66.50
*Bullish Scenario (15%)**: Recovery above 67.00 → Target 70-72
---
* **Key Economic Events to Watch**
*# **This Week**
- EIA Crude Oil Inventories (Wednesday)
- OPEC+ Meeting Minutes/Statements
- US GDP Data
- China Manufacturing PMI
*# **Next Week**
- Non-Farm Payrolls
- OPEC Monthly Oil Market Report
- China Trade Balance
---
* **Technical Confluence Summary**
*# **Strong Support Zone: 63.00-63.88**
- Previous significant lows
- Gann Square of 9 level
- 61.8% Fibonacci retracement
- Wyckoff support test zone
*# **Key Resistance Zone: 66.50-67.20**
- Weekly VWAP
- 200-day SMA
- Ichimoku cloud base
- Volume profile resistance
---
* **Trading Recommendations**
*# **Short-Term (1-2 weeks)**
**Bias**: Bearish below 65.00
**Strategy**: Sell rallies, buy only on oversold bounces
*# **Medium-Term (1 month)**
**Bias**: Bearish
**Target**: 58-60 range based on fundamental outlook
*# **Long-Term (3-6 months)**
**Bias**: Range-bound to bearish
**Range**: 55-70 with periodic volatility spikes
---
*Disclaimer: This analysis is for educational purposes. Always use proper risk management and consider your risk tolerance before trading.*
For those interested in further developing their trading skills based on these types of analyses, consider exploring the mentoring program offered by Shunya dot Trade.(world wide web shunya dot trade)
I welcome your feedback on this analysis, as it will inform and enhance my future work.
Regards,
Shunya.Trade
world wide web shunya dot trade
⚠️ Disclaimer: This post is educational content and does not constitute investment advice, financial advice, or trading recommendations. The views expressed here are based on technical analysis and are shared solely for informational purposes. The stock market is subject to risks, including capital loss, and readers should exercise due diligence before investing. We do not take responsibility for decisions made based on this content. Consult a certified financial advisor for personalized guidance.
* Current Position: 64.581 (August 23, 2025, 12:50 AM UTC+4)
---
* **Market Overview & Fundamental Backdrop**
*# Key Market Drivers:
*OPEC+ Production Increase**: Starting August 2025, OPEC+ nations increased output by 548,000 barrels per day
*Bearish Supply Outlook**: EIA forecasts Brent crude falling from $71/barrel in July to $58/barrel in Q4 2025
*Inventory Build**: Global oil inventories rising due to supply exceeding demand
*Current Price Action**: USOIL down 14.91% year-over-year, testing critical support zone
---
* **Multi-Timeframe Technical Analysis**
*# **Monthly/Weekly (Swing Analysis)**
**Elliott Wave Analysis:**
- Currently in Wave C of a corrective ABC pattern from 2024 highs
- Major support confluence at 63.88-64.72 zone (previous significant lows)
- If support fails, next target: 58-60 range (EIA fundamental target alignment)
**Wyckoff Analysis:**
- Phase C of Distribution: Testing support after distribution top
- Volume analysis suggests institutional selling on rallies
- Support test at current levels critical for future direction
*# **Daily Timeframe**
**Harmonic Patterns:**
- Potential Bearish Bat pattern completion around 66-67 resistance
- AB=CD pattern suggests 62-63 as next measured target if support breaks
**Ichimoku Analysis:**
- Price below all major Ichimoku levels (bearish)
- Kumo (cloud) acting as resistance around 67-69
- Tenkan-sen/Kijun-sen bearish cross occurred
*# **4H/1H Analysis**
**Key Levels:**
*Resistance**: 66.50, 67.20, 68.00
*Support**: 64.00, 63.88, 62.50
**RSI Analysis:**
- 4H RSI: 35-40 range (oversold territory)
- Divergence watch: Any bullish divergence could signal temporary bounce
**Bollinger Bands:**
- Price at lower band, suggesting potential oversold bounce
- Squeeze pattern developing, indicating volatility expansion ahead
**VWAP Analysis:**
- Daily VWAP: 65.80 (price below - bearish)
- Weekly VWAP: 67.20 (strong resistance)
*# **Intraday (5M-30M) Analysis**
**Moving Averages:**
- 20 EMA: Acting as immediate resistance at 64.80
- 50 SMA: Dynamic resistance at 65.50
- 200 SMA: Key level at 67.00
**Gann Theory Application:**
*Square of 9**: Next support at 63.00 (significant Gann level)
*Time Cycles**: 14-21 day cycle suggests potential reversal zone by August 28-30
*Gann Angles**: 2x1 angle support at 63.50
*Price Squaring**: 64² = important mathematical support
---
* **Weekly Trading Strategy (August 26-30, 2025)**
*# **Monday, August 26**
**Setup**: Support Bounce Play
*Entry**: 64.20-64.40 (if holding above 63.88)
*Stop Loss**: 63.70
*Target 1**: 65.20
*Target 2**: 65.80
*Risk-Reward**: 1:2
*# **Tuesday, August 27**
**Setup**: Breakdown Play (if Monday support fails)
*Entry**: Break below 63.80 with volume
*Stop Loss**: 64.30
*Target 1**: 62.50
*Target 2**: 61.80
*Risk-Reward**: 1:2.5
*# **Wednesday, August 28**
**Setup**: Range Trade
*Long Entry**: 63.00-63.20
*Short Entry**: 65.50-65.80
*Range SL**: 50 pips
*Range Targets**: Opposite side of range
*# **Thursday, August 29**
**Setup**: Momentum Follow
*Bullish**: Above 65.80 with volume → Target 66.50
*Bearish**: Below 63.00 → Target 61.50
*Stop**: 40-50 pips from entry
*# **Friday, August 30**
**Setup**: Weekly Close Strategy
*Focus**: Position for next week based on weekly close
*Above 64.50**: Bullish bias for next week
*Below 63.50**: Bearish bias for next week
---
* **Risk Management Framework**
*# **Position Sizing**
- Maximum risk per trade: 2% of account
- Daily loss limit: 4% of account
- Weekly loss limit: 8% of account
*# **Market Hours Focus**
*Best Volatility**: 13:30-17:00 UTC (US session)
*Asian Session**: 01:00-08:00 UTC (lower volatility)
*Overlap Periods**: Highest volume and best setups
---
* **Geopolitical & Macro Scenarios**
*# **Bearish Catalysts**
1. **OPEC+ Further Production Increases**: Could push prices to $58-60 range
2. **US Strategic Reserve Releases**: Additional supply pressure
3. **China Economic Slowdown**: Reduced demand expectations
4. **Recession Fears**: Global demand destruction
*# **Bullish Catalysts**
1. **Middle East Tensions**: Any supply disruption risk
2. **OPEC+ Production Reversal**: If they halt planned increases
3. **Hurricane Season**: Potential Gulf of Mexico disruptions
4. **Geopolitical Tensions**: Russia-Ukraine, Iran tensions
*# **Probability Assessment**
*Bearish Scenario (60%)**: Break below 63.88 → Target 58-60
*Neutral Scenario (25%)**: Range-bound 63.50-66.50
*Bullish Scenario (15%)**: Recovery above 67.00 → Target 70-72
---
* **Key Economic Events to Watch**
*# **This Week**
- EIA Crude Oil Inventories (Wednesday)
- OPEC+ Meeting Minutes/Statements
- US GDP Data
- China Manufacturing PMI
*# **Next Week**
- Non-Farm Payrolls
- OPEC Monthly Oil Market Report
- China Trade Balance
---
* **Technical Confluence Summary**
*# **Strong Support Zone: 63.00-63.88**
- Previous significant lows
- Gann Square of 9 level
- 61.8% Fibonacci retracement
- Wyckoff support test zone
*# **Key Resistance Zone: 66.50-67.20**
- Weekly VWAP
- 200-day SMA
- Ichimoku cloud base
- Volume profile resistance
---
* **Trading Recommendations**
*# **Short-Term (1-2 weeks)**
**Bias**: Bearish below 65.00
**Strategy**: Sell rallies, buy only on oversold bounces
*# **Medium-Term (1 month)**
**Bias**: Bearish
**Target**: 58-60 range based on fundamental outlook
*# **Long-Term (3-6 months)**
**Bias**: Range-bound to bearish
**Range**: 55-70 with periodic volatility spikes
---
*Disclaimer: This analysis is for educational purposes. Always use proper risk management and consider your risk tolerance before trading.*
For those interested in further developing their trading skills based on these types of analyses, consider exploring the mentoring program offered by Shunya dot Trade.(world wide web shunya dot trade)
I welcome your feedback on this analysis, as it will inform and enhance my future work.
Regards,
Shunya.Trade
world wide web shunya dot trade
⚠️ Disclaimer: This post is educational content and does not constitute investment advice, financial advice, or trading recommendations. The views expressed here are based on technical analysis and are shared solely for informational purposes. The stock market is subject to risks, including capital loss, and readers should exercise due diligence before investing. We do not take responsibility for decisions made based on this content. Consult a certified financial advisor for personalized guidance.
I am nothing @shunya.trade
Disclaimer
The information and publications are not meant to be, and do not constitute, financial, investment, trading, or other types of advice or recommendations supplied or endorsed by TradingView. Read more in the Terms of Use.
I am nothing @shunya.trade
Disclaimer
The information and publications are not meant to be, and do not constitute, financial, investment, trading, or other types of advice or recommendations supplied or endorsed by TradingView. Read more in the Terms of Use.