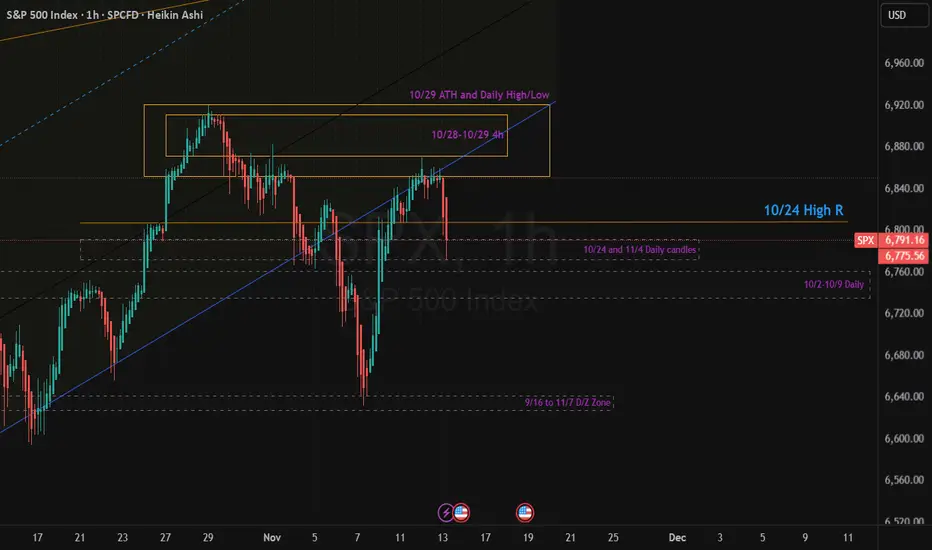
SPX rejected cleanly from the 10/28–10/29 supply zone and the parabolic midline (blue). The lower parabolic channel on 11/10 (check the chart) - this level that flipped from support to resistance after Nov 10.
Currently, price is testing the 10/24 High R zone (~6774) with strong downside momentum shown on Heikin Ashi
Key Levels:
Scenarios:
Overall momentum remains bearish after rejection from the parabolic curve. Bulls must reclaim 6830+ to shift structure.
Currently, price is testing the 10/24 High R zone (~6774) with strong downside momentum shown on Heikin Ashi
Key Levels:
- Resistance: 6830–6870 (midline + prior rejection block)
- Suport 1: 6780 (10/24 High R)
- Support 2: 6720–6650 (10/2–10/9 & 9/16–11/7 demand zones)
Scenarios:
- Bounce: If 6780 holds, expect a short-term relief rally toward 6830–6850 (mean reversion).
- Breakdown: A 1H close below 6775 opens room for 6720 and possibly 6650.
Overall momentum remains bearish after rejection from the parabolic curve. Bulls must reclaim 6830+ to shift structure.
Disclaimer
The information and publications are not meant to be, and do not constitute, financial, investment, trading, or other types of advice or recommendations supplied or endorsed by TradingView. Read more in the Terms of Use.
Disclaimer
The information and publications are not meant to be, and do not constitute, financial, investment, trading, or other types of advice or recommendations supplied or endorsed by TradingView. Read more in the Terms of Use.