When it does, how long will that top last?
The question on the minds of many is just how high this blow-off top in the stock market will go. The cyclical bull market is running a bit long in the tooth and, by every conceivable measure, should be due for a healthy correction at the very least.
No, we’re not talking about the bull market run from the Tariff Tantrum lows in April; we’re talking about a 16-year run-up from the 2009 lows of the Great Financial Crisis—a low, in my view, that was never allowed to clear adequately.
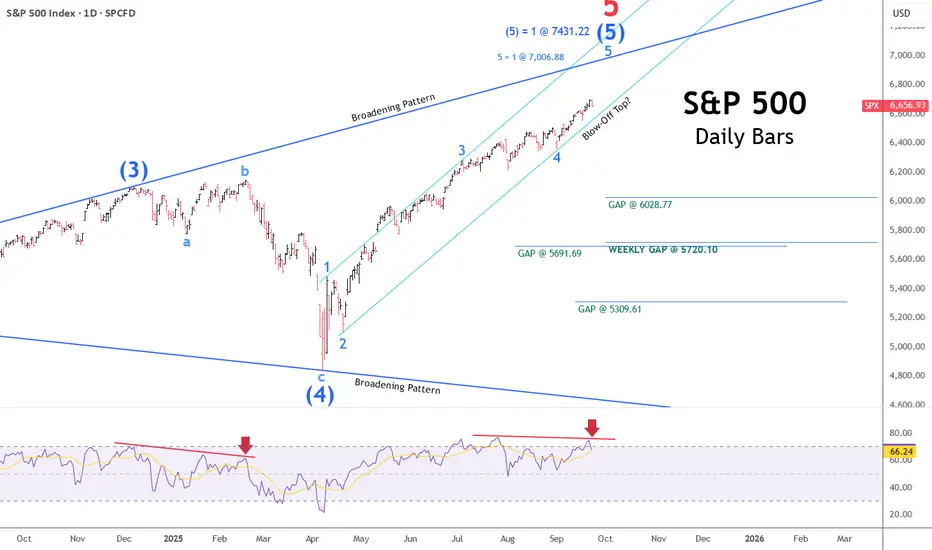
The chart below illustrates the short-term, quintessential V-shaped recovery rebound from the April lows this past spring. These instant recoveries to fresh all-time highs have been a hallmark since the COVID bottom in 2020.

The daily chart above shows five clear waves of advance within a larger broadening pattern. Though a top can form at a moment’s notice from this point forward, the daily chart indicates two outstanding upside price targets at 7,006.88 and 7,431.22, respectively—each a Fibonacci extension of previous wave relationships.
Near-term downside targets ripe for the taking amid any meaningful pullback are represented by the four open gaps listed in the daily chart.
Next, we’ll zoom in a bit closer, looking at a 3-hour chart just before today’s close, with the S&P down slightly, just over half of one percent.

The shaded box above the price action illustrates an upside target window ranging from 6,704.45 on the low end to 7,006.88 on the high side, with an additional target of 6,710.67—also near the lower end of the range. The session’s high earlier was 6,699.52, less than 5 points from the threshold of our standing target window.
I’ll close out this stock market update with our long-term trading chart, which tracks the S&P’s weekly bars from the COVID low.

Above, you can see the broadening pattern mentioned earlier, along with another upside Fibonacci extension target noted at 7,431.22 and an important weekly gap at the 5,720.10 level.
The long-term buy-and-sell indicators at the top and bottom of the chart are not designed to capture or pick tops and bottoms; rather, they aim to capture the lion’s share of a given long-term trend and help you avoid devastating crashes and extended bear markets.
The lower-panel histogram issues buy signals a bit earlier and sell signals a bit later, while the upper-panel crossover study tends to be more active, issuing sell signals earlier and buy signals later.
Regardless of where and when the market tops—if it ever does—at the rate we’re going, be mindful of the risks inherent in making assumptions and extrapolating past performance into future expectations. Why? Because amid the Fourth Turning, old rules may no longer apply, and market tops may last much longer than we have become accustomed to.
The question on the minds of many is just how high this blow-off top in the stock market will go. The cyclical bull market is running a bit long in the tooth and, by every conceivable measure, should be due for a healthy correction at the very least.
No, we’re not talking about the bull market run from the Tariff Tantrum lows in April; we’re talking about a 16-year run-up from the 2009 lows of the Great Financial Crisis—a low, in my view, that was never allowed to clear adequately.
The chart below illustrates the short-term, quintessential V-shaped recovery rebound from the April lows this past spring. These instant recoveries to fresh all-time highs have been a hallmark since the COVID bottom in 2020.
The daily chart above shows five clear waves of advance within a larger broadening pattern. Though a top can form at a moment’s notice from this point forward, the daily chart indicates two outstanding upside price targets at 7,006.88 and 7,431.22, respectively—each a Fibonacci extension of previous wave relationships.
Near-term downside targets ripe for the taking amid any meaningful pullback are represented by the four open gaps listed in the daily chart.
Next, we’ll zoom in a bit closer, looking at a 3-hour chart just before today’s close, with the S&P down slightly, just over half of one percent.
The shaded box above the price action illustrates an upside target window ranging from 6,704.45 on the low end to 7,006.88 on the high side, with an additional target of 6,710.67—also near the lower end of the range. The session’s high earlier was 6,699.52, less than 5 points from the threshold of our standing target window.
I’ll close out this stock market update with our long-term trading chart, which tracks the S&P’s weekly bars from the COVID low.
Above, you can see the broadening pattern mentioned earlier, along with another upside Fibonacci extension target noted at 7,431.22 and an important weekly gap at the 5,720.10 level.
The long-term buy-and-sell indicators at the top and bottom of the chart are not designed to capture or pick tops and bottoms; rather, they aim to capture the lion’s share of a given long-term trend and help you avoid devastating crashes and extended bear markets.
The lower-panel histogram issues buy signals a bit earlier and sell signals a bit later, while the upper-panel crossover study tends to be more active, issuing sell signals earlier and buy signals later.
Regardless of where and when the market tops—if it ever does—at the rate we’re going, be mindful of the risks inherent in making assumptions and extrapolating past performance into future expectations. Why? Because amid the Fourth Turning, old rules may no longer apply, and market tops may last much longer than we have become accustomed to.
Related publications
Disclaimer
The information and publications are not meant to be, and do not constitute, financial, investment, trading, or other types of advice or recommendations supplied or endorsed by TradingView. Read more in the Terms of Use.
Related publications
Disclaimer
The information and publications are not meant to be, and do not constitute, financial, investment, trading, or other types of advice or recommendations supplied or endorsed by TradingView. Read more in the Terms of Use.