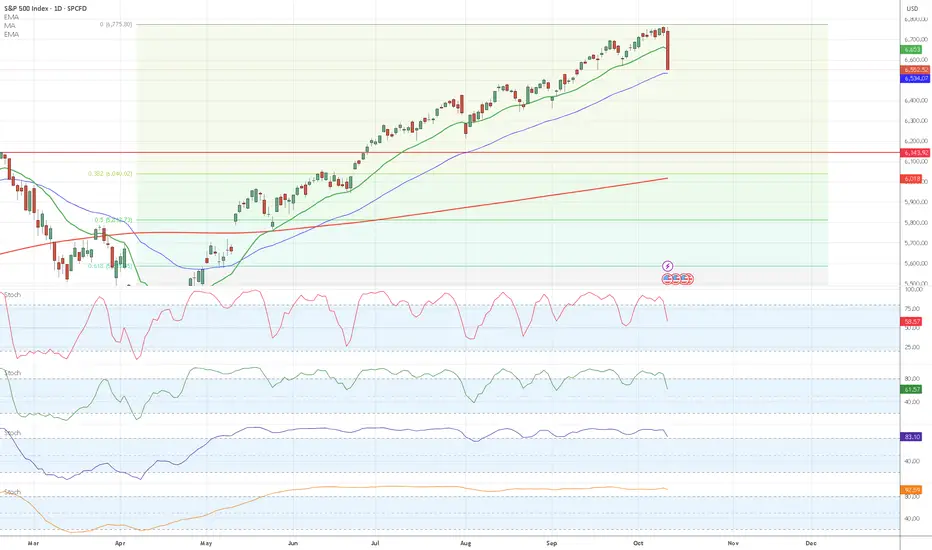
SPX (S&P 500) Technical Levels Quick Breakdown
Current Price: 6,552.51 (as of Oct 10, 2025 close, down 2.71%; futures suggest mild rebound at Oct 11 open).
Key Levels (Classic Pivots):
Support: S1 $6,576 | S2 $6,562 (watch for breakdown below S2 toward $6,500).
Resistance: R1 $6,613 | R2 $6,637 (clearing R1 eyes $6,700 round number).
Pivot: $6,600 (neutral gravity point).
Key Indicators (Daily Timeframe):
RSI(14): 18.6 (deeply oversold—potential bounce setup above 30).
MACD(12,26): -34.8 (strong sell signal, bearish momentum).
Moving Averages: All sell (e.g., 5-day SMA $6,602; 50-day $6,717; 200-day $6,619—price well below, confirming downtrend).
Overall: Strong sell across MAs and indicators, but oversold RSI flags exhaustion risk for a relief rally. Watch volume on any upside push.
Disclaimer
The information and publications are not meant to be, and do not constitute, financial, investment, trading, or other types of advice or recommendations supplied or endorsed by TradingView. Read more in the Terms of Use.
Disclaimer
The information and publications are not meant to be, and do not constitute, financial, investment, trading, or other types of advice or recommendations supplied or endorsed by TradingView. Read more in the Terms of Use.