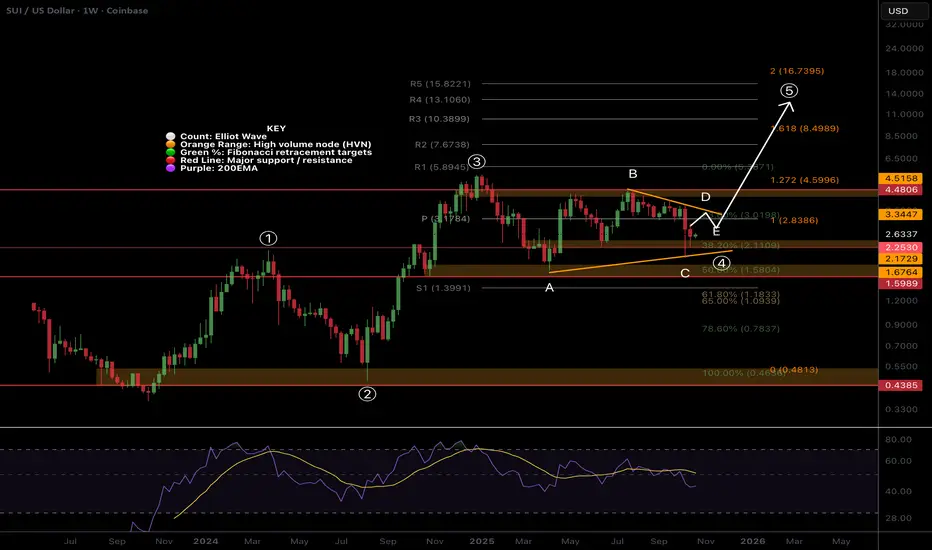
Wave (5) has a minimum target of the R5 weekly pivot at $15.8, at the 2 Fibonacci extension.
Falling below $1.7, wave A, invalidates the analysis and suggests we have much lower to go in a bear market.
Weekly RSI is bearish with lower to go but hidden bullish divergence has formed, a good raly will confirm.
SUI i holding up better than most with shallower retracements overall.
Safe trading
PhD Cand: Investing, Sentiment & Social Mood, MSc Financial Econ
Technical Analyst 8 years, Trader/Investor 15 years
Market Breakdown & Alpha Reports: detrended.substack.com
Earn & Learn Trade Planning & Signals (FREE WEEK): tradesignals.substack.com
Technical Analyst 8 years, Trader/Investor 15 years
Market Breakdown & Alpha Reports: detrended.substack.com
Earn & Learn Trade Planning & Signals (FREE WEEK): tradesignals.substack.com
Related publications
Disclaimer
The information and publications are not meant to be, and do not constitute, financial, investment, trading, or other types of advice or recommendations supplied or endorsed by TradingView. Read more in the Terms of Use.