Syngene International – Daily & Weekly Chart Analysis
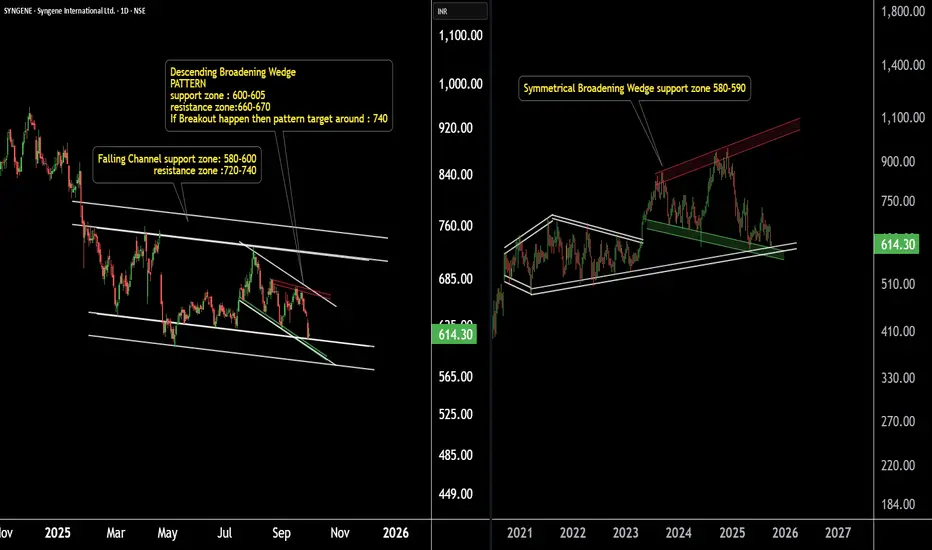
Syngene International is exhibiting a confluence of patterns across multiple timeframes, all aligning near a strong support zone.
On the weekly chart, the stock is forming a broadening wedge pattern, with a key support zone around ₹580–590.
On the daily chart, Syngene is trading within a well-defined falling channel, with support again placed near ₹580–590.
Additionally, the price structure is also shaping into a descending broadening wedge, with support around ₹590–600.
Key Insight:
The presence of multiple patterns converging near the same support zone highlights the significance of this level. Sustaining above ₹580–600 could pave the way for a strong reversal move in the coming sessions.
@RahulSaraoge
Connect us at t.me/stridesadvisory
Connect us at t.me/stridesadvisory
Disclaimer
The information and publications are not meant to be, and do not constitute, financial, investment, trading, or other types of advice or recommendations supplied or endorsed by TradingView. Read more in the Terms of Use.