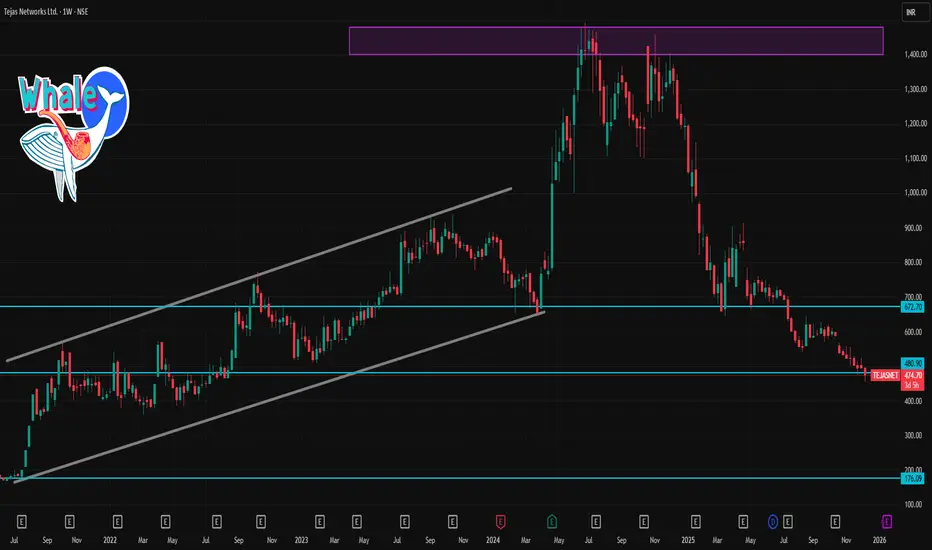
📌 Recent Price & Context
According to a live quote on 9 Dec 2025, Tejas Networks is trading around ₹471–₹476.
Recent technical‑indicator feeds (on daily chart) show oversold conditions: e.g. RSI ~ 20 (oversold), MACD negative, ADX high — indicating downward momentum + volatility.
On weekly‑timeframe classification, some aggregator sources rate the trend as “strong sell.”
So at this moment, the bias is bearish to neutral, unless a reversal catalyst emerges.
🎯 Weekly Pivot / Key Levels (Support & Resistance)
Using the most recent weekly pivot analysis:
Level Price (Approx)
Weekly Pivot (central) ₹503.7
Support Zone 1 (S1) ~ ₹482.5
Support Zone 2 (S2) ~ ₹470.9
Resistance 1 (R1) ~ ₹515.3
Resistance 2 (R2) ~ ₹536.5
Resistance 3 (R3) ~ ₹548.0–₹550+
Interpretation
The pivot at ₹503.7 marks the “line of neutrality.” Weekly closes above this level would shift bias more bullish.
As of now, with price ~ ₹472–₹476, the stock is well below weekly pivot → bearish / consolidation regime.
Downside buffer / support lies around ₹470–₹482; a breakdown below that could open further downside risk (unless long‑term support zones hold).
Upside resistance cluster lies at ₹515 → ₹536 → ₹548. To regain bullish momentum, price needs to first clear ₹503–₹515 zone, then aim higher.
Related publications
Disclaimer
The information and publications are not meant to be, and do not constitute, financial, investment, trading, or other types of advice or recommendations supplied or endorsed by TradingView. Read more in the Terms of Use.
Related publications
Disclaimer
The information and publications are not meant to be, and do not constitute, financial, investment, trading, or other types of advice or recommendations supplied or endorsed by TradingView. Read more in the Terms of Use.