Hi friends! Welcome to this update analysis on the TLT — the ETF that tracks 20 year treasuries! As you know, most of my posts are on cryptocurrencies, but crypto is not where the majority of my investments are. Enter the TLT! I have been bearish on bonds, for several months now, and I've actually been accumulating the Jan 20 100 Strike put contracts. In this update analysis, we're going to delve into the technical, and fundamental reasons why I believe that the bond market is on the verge of a meltdown. Before we get into that, it's important to know straight away, that bonds and interest rates counteract one another. Lately, the fed has been hiking interest rates, at 0.25% a hike, and this has a negative effect on bond yields. You may think that a 0.25% hike wouldn't have a very dramatic effect on reducing bond yields, but I think that theory is very wrong, particularly because interest rates were artificially suppressed by the Fed, after the Great Recession, which inadvertently artificially inflated bond yields. Now that the Fed has to hike rates, the overly inflated bond market should plummet from its lofty heights.
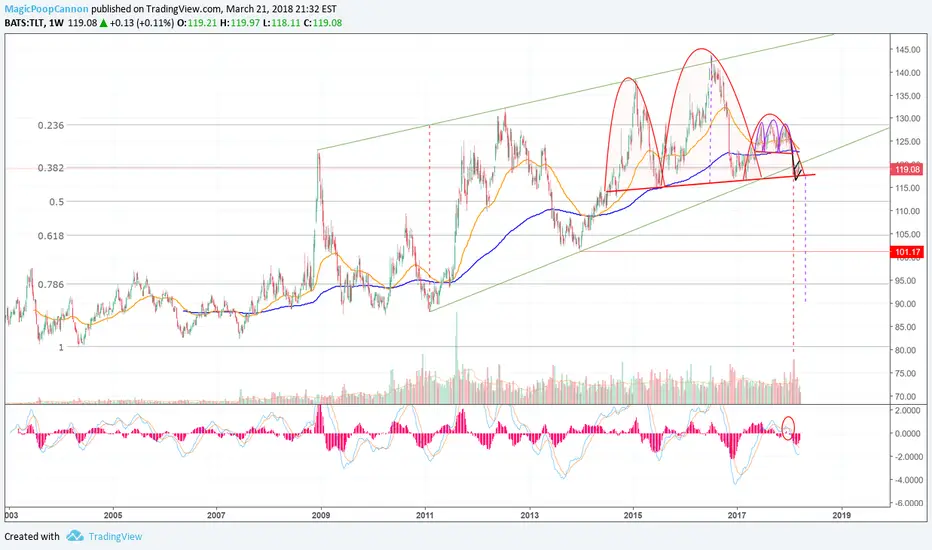
This is a weekly chart, so keep in mind that it is a multiyear time-frame. Looking at the technical data, we can see that after the Fed stepped in during the Great Recession, there was a huge spike in the TLT (late 2008) as the markets got wind of the fact that the Fed was going to implement quantitative easing, and suppress interest rates to rescue the economy. Since then, the TLT has traded within an enormous bearish rising wedge (green trendlines.) In terms of the more recent action, the TLT has been trading inside of a gigantic head and shoulders pattern, since 2014. You can see that the right shoulder has completed, and price briefly dropped below the neckline support of the head and shoulders pattern, but pulled back up, in the form of a bear flag. This current bear flag action is taking place below the bearish rising wedge, but above the neckline support of the head and shoulders pattern. So, we have multiple reasons to believe that a powerful breakdown is about to occur, both technically and fundamentally.
In terms of where this market could go, you can see that a full scale correction that is equal to the corrective potential of the bearish rising wedge (in red dashes) could send the TLT below 80! I really hope that happens, because I will be sitting on some MAJOR gains. However, it may not be that severe. Interestingly, the 80ish level, is right around where the 100% retracement lies, for the entire price range of this chart.
When the full corrective potential of the head and shoulders formation is taken into consideration, you can see that it extends to about the 90 level. Obviously, there's major support at 101.17, but if things get really violent in the bond market, I wouldn't be surprised to see that level fall. With the trade war about to kick off, we may even see an unraveling of the global debt crisis which could cause hyper inflation, triggering rapid interest rate hikes by the fed, and that would obliterate bonds. I know that's a hypothetical scenario, but it is a very realistic one. In fact, it's realistic enough to cause me to short the hell out of the bond market, and I'm all over it.
I'm the master of the charts, the professor, the legend, the king, and I go by the name of Magic! Au revoir.
***This information is not a recommendation to buy or sell. It is to be used for educational purposes only.***
-Magic loves you-
-JD-
Note
My last TLT post:
Note
"Prices" instead of "yields."Disclaimer
The information and publications are not meant to be, and do not constitute, financial, investment, trading, or other types of advice or recommendations supplied or endorsed by TradingView. Read more in the Terms of Use.
Disclaimer
The information and publications are not meant to be, and do not constitute, financial, investment, trading, or other types of advice or recommendations supplied or endorsed by TradingView. Read more in the Terms of Use.