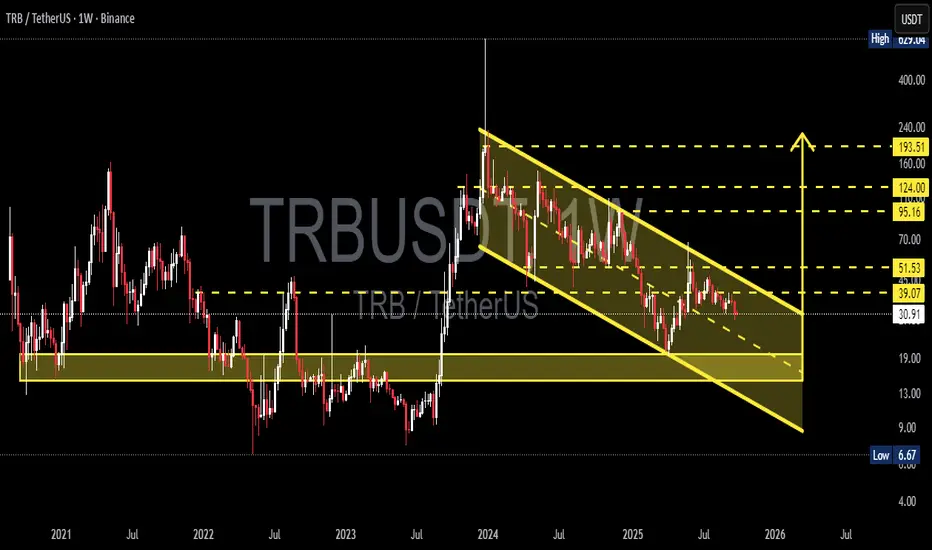
TRB (Tellor) is now entering a crucial phase. After the massive rally in 2024, the market has pushed TRB into a structured correction forming a clear descending channel on the weekly timeframe. This chart reflects the ongoing battle between long-term accumulation and medium-term selling pressure.
---
🔎 Technical Structure
1. Descending Channel (Bearish Structure):
Price continues to form lower highs & lower lows, confirming sellers remain dominant.
The channel can act either as a distribution phase before further breakdown, or a long-term accumulation phase before reversal.
2. Historical Support Zone (13 – 19 USDT):
This area has served as a major turning point multiple times since 2021.
A breakdown below this level could trigger a capitulation move toward the channel bottom near 9 USDT.
3. Key Resistance (39 – 51 USDT):
This is the “first gateway” for bullish validation.
A strong breakout here with volume could unlock a rally toward 95 – 124 USDT.
4. Fibonacci / Historical Levels:
95.16 → Strong psychological resistance.
124.00 → Potential major profit-taking zone.
193.51 → Long-term target if a full bullish trend resumes.
---
🚀 Bullish Scenario (Potential Reversal)
Confirmation: Weekly close above the descending channel with a successful retest.
Targets (Stage 1): 39.07 → 51.53.
Targets (Stage 2): 95.16 → 124.00.
Narrative: A breakout from the channel signals the end of the long correction, opening the door for buyers to step in aggressively above 51 USDT.
---
📉 Bearish Scenario (Continuation)
Confirmation: Strong rejection at the channel upper boundary + breakdown below 30 USDT.
Targets (Stage 1): 19 USDT (minor support).
Targets (Stage 2): 13 USDT → 9 USDT (channel bottom).
Narrative: As long as price remains within the channel, bearish sentiment dominates. A breakdown of historical support means a potential capitulation before the next accumulation cycle.
---
🧭 Trading Strategy
Conservative Traders: Wait for a weekly breakout + retest before going long (low risk – high reward).
Aggressive Traders: Scale into the 13 – 19 zone with tight stops below 13.
Short Traders: Look for rejection at the upper/midline channel for swing shorts targeting support zones.
Risk Management: TRB is highly volatile (as seen in 2024) — always cap risk at 1–3% per position.
---
📌 Conclusion
TRB is at a major crossroads. While the descending channel still favors the bearish trend, a confirmed breakout would be a game-changer, signaling the end of correction and opening the way toward 95–124 USDT. On the flip side, failure to hold above 30 could drag price back to 13–19 or even 9 USDT.
This setup is not just about chart patterns, but also about market psychology: Is TRB ready for long-term accumulation, or is one more leg down still ahead?
---
#TRB #TRBUSDT #Crypto #Altcoin #PriceAction #TechnicalAnalysis #DescendingChannel #Breakout #SwingTrading #SupportResistance
---
🔎 Technical Structure
1. Descending Channel (Bearish Structure):
Price continues to form lower highs & lower lows, confirming sellers remain dominant.
The channel can act either as a distribution phase before further breakdown, or a long-term accumulation phase before reversal.
2. Historical Support Zone (13 – 19 USDT):
This area has served as a major turning point multiple times since 2021.
A breakdown below this level could trigger a capitulation move toward the channel bottom near 9 USDT.
3. Key Resistance (39 – 51 USDT):
This is the “first gateway” for bullish validation.
A strong breakout here with volume could unlock a rally toward 95 – 124 USDT.
4. Fibonacci / Historical Levels:
95.16 → Strong psychological resistance.
124.00 → Potential major profit-taking zone.
193.51 → Long-term target if a full bullish trend resumes.
---
🚀 Bullish Scenario (Potential Reversal)
Confirmation: Weekly close above the descending channel with a successful retest.
Targets (Stage 1): 39.07 → 51.53.
Targets (Stage 2): 95.16 → 124.00.
Narrative: A breakout from the channel signals the end of the long correction, opening the door for buyers to step in aggressively above 51 USDT.
---
📉 Bearish Scenario (Continuation)
Confirmation: Strong rejection at the channel upper boundary + breakdown below 30 USDT.
Targets (Stage 1): 19 USDT (minor support).
Targets (Stage 2): 13 USDT → 9 USDT (channel bottom).
Narrative: As long as price remains within the channel, bearish sentiment dominates. A breakdown of historical support means a potential capitulation before the next accumulation cycle.
---
🧭 Trading Strategy
Conservative Traders: Wait for a weekly breakout + retest before going long (low risk – high reward).
Aggressive Traders: Scale into the 13 – 19 zone with tight stops below 13.
Short Traders: Look for rejection at the upper/midline channel for swing shorts targeting support zones.
Risk Management: TRB is highly volatile (as seen in 2024) — always cap risk at 1–3% per position.
---
📌 Conclusion
TRB is at a major crossroads. While the descending channel still favors the bearish trend, a confirmed breakout would be a game-changer, signaling the end of correction and opening the way toward 95–124 USDT. On the flip side, failure to hold above 30 could drag price back to 13–19 or even 9 USDT.
This setup is not just about chart patterns, but also about market psychology: Is TRB ready for long-term accumulation, or is one more leg down still ahead?
---
#TRB #TRBUSDT #Crypto #Altcoin #PriceAction #TechnicalAnalysis #DescendingChannel #Breakout #SwingTrading #SupportResistance
✅ Get Free Signals! Join Our Telegram Channel Here: t.me/TheCryptoNuclear
✅ Twitter: twitter.com/crypto_nuclear
✅ Join Bybit : partner.bybit.com/b/nuclearvip
✅ Benefits : Lifetime Trading Fee Discount -50%
✅ Twitter: twitter.com/crypto_nuclear
✅ Join Bybit : partner.bybit.com/b/nuclearvip
✅ Benefits : Lifetime Trading Fee Discount -50%
Disclaimer
The information and publications are not meant to be, and do not constitute, financial, investment, trading, or other types of advice or recommendations supplied or endorsed by TradingView. Read more in the Terms of Use.