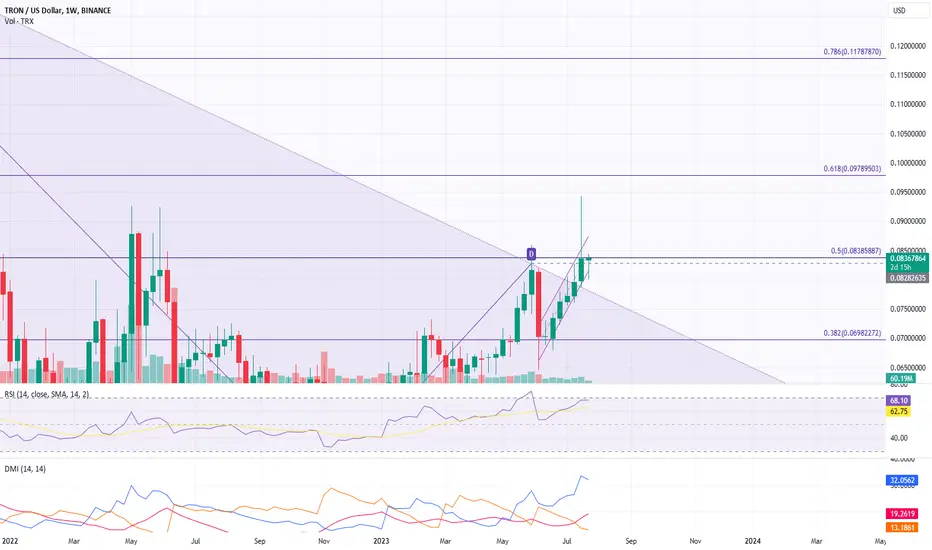
- The TRX price shows a descending triangle breakout on the weekly chart and is up by nearly 28% over the past two months.
- After a massive 500% rise in 2021, the TRX price trend started to decline in a descending triangle pattern, with bottom support at $0.045.
- A recent recovery rally of 28% starting from the 38.20% Fibonacci level indicates potential for a sustained breakout in 2023.
- With a morning star pattern at the 38.20% Fibonacci level, TRX coin price is currently at $0.0833, showing a bullish breakout from the triangle pattern.
- Five consecutive bullish candles in the weekly chart, and a rising channel pattern in the daily chart, suggest further bullish growth.
- Despite facing resistance from the 50% Fibonacci level at $0.8385, if TRX price closes above this level, it could potentially reach $0.10.
- The RSI line is near the oversold boundary and the ADX line in the DMI indicator shows high trend momentum, suggesting further growth.
- If TRX price crosses the $0.8385 mark, it could potentially breach the $0.10 level and challenge the overhead supply at $0.1178 (78.60% Fibonacci level).
- However, if the rising channel breaks, TRX prices could retest at $0.077.
Disclaimer
The information and publications are not meant to be, and do not constitute, financial, investment, trading, or other types of advice or recommendations supplied or endorsed by TradingView. Read more in the Terms of Use.
Disclaimer
The information and publications are not meant to be, and do not constitute, financial, investment, trading, or other types of advice or recommendations supplied or endorsed by TradingView. Read more in the Terms of Use.