TRX/USD Secondary trend (part) 18 11 2023Logarithm. Time frame 3 days.
The ascending channel in the lower part of the big triangle. Local work in it from the key support / resistance levels.
The whole range of this channel on a larger scale. .
Everything is more detailed and shown in the ideas of the main trend. .
TRX/USD Main t
Key stats
About TRON
Tron is one of the largest stablecoin settlement blockchains in crypto. The Tron blockchain is a delegated proof of stake, layer 1, smart contract solution that allows for decentralized applications to be built on it. These applications center around decentralized finance, NFTs and Web3. It's unique in that it utilizes an energy and bandwidth system, instead of gas, to make Tron blockchain transactions essentially free for large users.

Cup and Handle Strong Bullish Pattern, Take trade after breakout and always manage your risk and do your own analysis before taking any trade.

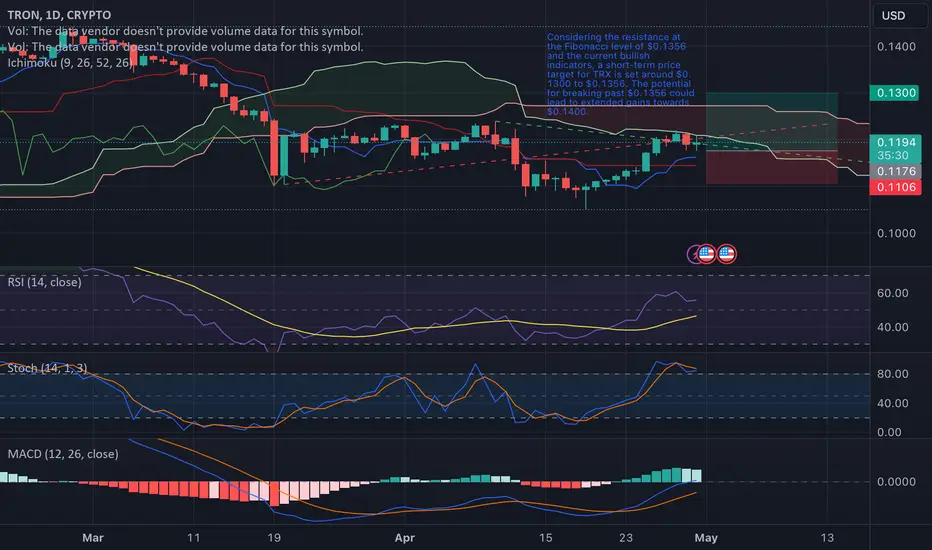
TRON (TRXUSD) Technical AnalysisTRON (TRXUSD) has experienced a varied trend over the past few months, showing signs of both bullish and bearish momentum. As of the last available trading session, TRON trades at $0.1193, showcasing a modest intraday gain. The trading environment is marked by fluctuations, and our analysis will del
TRX Sitting on Launch Pad to $10+TRX Has broken out from this 6 year triangle and perfectly retested the trendline. As long as support at 11 cents holds TRON looks ready to finally end 6 years of volatility compression with a massive decompression that could send prices vertical in a similar fashion as what we saw in 2018.
Best ca


TRXLong time no see with TRX :D I still think this looks bullish. Can't see a distribution like action. Most likely, dalai lama to the highs, a little pullback, big green candles.

TRX Bullish Bias (Monthly)TRX Price $0.133197
TRON ROI 6909.8%
Market Cap $9,544,890,728
Market Cap Dominance 0.38%
Trading Volume $5,067,746,034
Another coin that fell off many people's portfolios after the broken hearts and lack of movement after the 2017 hype. Here are a couple of my proposed scenarios. In order for

Potential Bull Market Continuation (Elliott Wave)After reassessing the wave structure on TRX with Glenn Neely, particularly the structure which began at the high in 2021 up until now, it seems to indicate that we are in a complex correction which began with a triangle and is now ending with a diametric.
If this is correct, TRX should be beginning

TRXUSD Support Channel UpAMEX:TRX perform a good bullish wave, and reach channel up support.
This is a good moment to enter and follow bullish market at TRX.
we can buy now around 0.13620 or wait after bullish confirmation trendline broken up.
I will update this analysis if I found a new key level.
Don't forget to support


See all ideas
Curated watchlists where TRXUSD is featured.

Gen 3 crypto: A new day dawns…
25 No. of Symbols

Smart contracts: Make the smart decision
36 No. of Symbols

Staking Coins: Pick up a stake
18 No. of Symbols

Top altcoins: Choose your alternatives carefully
28 No. of Symbols
See all sparks
Related symbols
Frequently Asked Questions
The current price of TRON (TRX) is 0.12594415 USD — it has risen 0.07% in the past 24 hours. Try placing this info into the context by checking out what coins are also gaining and losing at the moment and seeing TRX price chart.
TRON (TRX) reached the lowest price of 0.00148369 USD on Nov 12, 2017. View more TRON dynamics on the price chart.
See the list of crypto losers to find unexpected opportunities.
See the list of crypto losers to find unexpected opportunities.
The current market capitalization of TRON (TRX) is 11.02 B USD. To see this number in a context check out our list of crypto coins ranked by their market caps or see crypto market cap charts.
TRON (TRX) trading volume in 24 hours is 244.63 M USD. See how often other coins are traded in this list.
Crypto markets are famous for their volatility, so one should study all the available stats before adding crypto assets to their portfolio. Very often it's technical analysis that comes in handy. We prepared technical ratings for TRON (TRX): today its technical analysis shows the buy signal, and according to the 1 week rating TRX shows the strong buy signal. And you'd better dig deeper and study 1 month rating too — it's buy. Find inspiration in TRON trading ideas and keep track of what's moving crypto markets with our crypto news feed.
TRON price has risen by 6.02% over the last week, its month performance shows a 14.35% increase, and as for the last year, TRON has increased by 81.26%. See more dynamics on TRX price chart.
Keep track of coins' changes with our Crypto heatmap.
Keep track of coins' changes with our Crypto heatmap.
The current circulating supply of TRON (TRX) is 87.48 B USD. To get a wider picture you can check out our list of coins with the highest circulating supply, as well as the ones with the lowest number of tokens in circulation.
TRON (TRX) reached its highest price on Jan 5, 2018 — it amounted to 0.35056124 USD. Find more insights on the TRX price chart.
See the list of crypto gainers and choose what best fits your strategy.
See the list of crypto gainers and choose what best fits your strategy.
TRON (TRX) is just as reliable as any other crypto asset — this corner of the world market is highly volatile. Today, for instance, TRON is estimated as 1.28% volatile. The only thing it means is that you must prepare and examine all available information before making a decision. And if you're not sure about TRON, you can find more inspiration in our curated watchlists.
You can discuss TRON (TRX) with other users in our public chats, Minds or in the comments to Ideas.
TRON highest price ever is 0.35056124 USD, and the maximum drawdown from this value it has ever experienced is 23.53 K%, when TRON reached 0.00148369 USD. See more of TRX price dynamics on the chart.
The safest choice when buying TRX is to go to a well-known crypto exchange. Some of the popular names are Binance, Coinbase, Kraken. But you'll have to find a reliable broker and create an account first. You can trade TRX right from TradingView charts — just choose a broker and connect to your account.