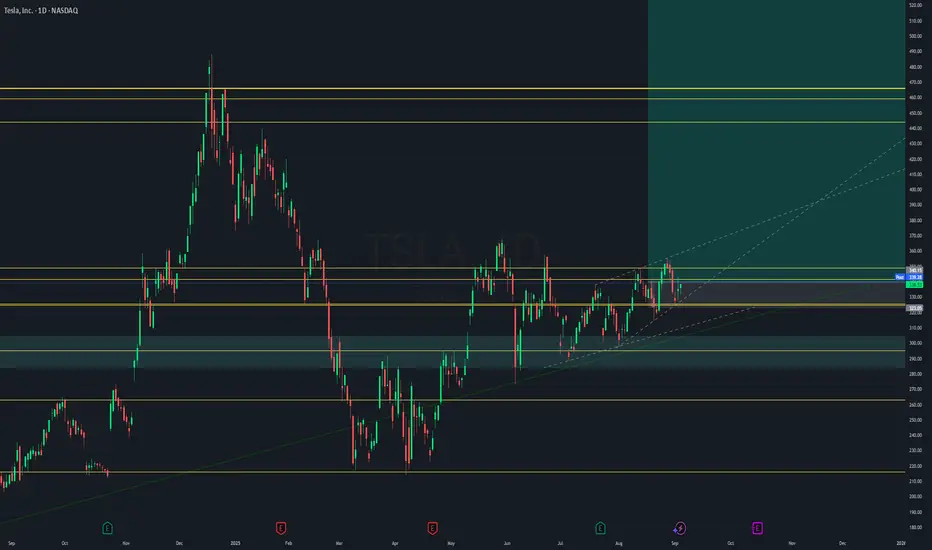
TL;DR: TSLA is holding above the 0.5 retrace (~$334). A daily close above $355 opens $366 → $372 → $381. Lose $334 → $330 and the setup degrades toward $324/314.
Thesis
The prior swing’s Fibonacci map shows confluence at $350–355 (0.786/0.886 + round-number supply).
Structure is compressing above $334–335 support. A clean break/hold above $355 would likely trigger an extension leg to 1.272/1.414/1.618 at $366.7 / $372.5 / $381.0.
Below $334, momentum likely rotates back into the $330 → $324 → $314 demand ladder.
Key Levels
Support: $334.5 (0.5), $330.0 (0.382), $323.9 (0.236), $314.2 base
Trigger/Resistance: $347–350 (0.786–0.886), $355.5 (1.0)
Upside Targets: $366.7 (1.272) / $372.5 (1.414) / $381.0 (1.618) then $396.7 / $408.0 / $422.2 / $444.9
Trade Plan (alerts + confirmations, no auto-trading)
Scenario A – Break & Go (preferred)
Confirmation: Daily close above $355.
Execution: Drop to M15 for structure; take a retest of $350–355 as support.
M5 confirm: Bullish engulfing + MACD uptick.
Risk: Invalidation below $347 (or last M15 swing-low).
Targets: $366.7 → $372.5 → $381.0 (scale out).
Scenario B – Pullback Buy
Price tags $334–336 and holds (wicks rejection).
M15 forms HL; M5 prints engulfing + MACD cross.
Risk: Invalidation below $329.9.
Targets: $347 → $355 → $366.7.
Scenario C – Bearish Breakdown
Invalidation of bull idea: Full M15 body below $329.9 → look for $324 → $314. No longs until reclaimed.
Risk (keep it tight)
Risk %: 0.5–1% per idea.
Placement: Below invalidation or last M15 swing.
Scaling: 30/30/40 across targets; move stop to breakeven after Target 1.
Disclaimer
The information and publications are not meant to be, and do not constitute, financial, investment, trading, or other types of advice or recommendations supplied or endorsed by TradingView. Read more in the Terms of Use.
Disclaimer
The information and publications are not meant to be, and do not constitute, financial, investment, trading, or other types of advice or recommendations supplied or endorsed by TradingView. Read more in the Terms of Use.