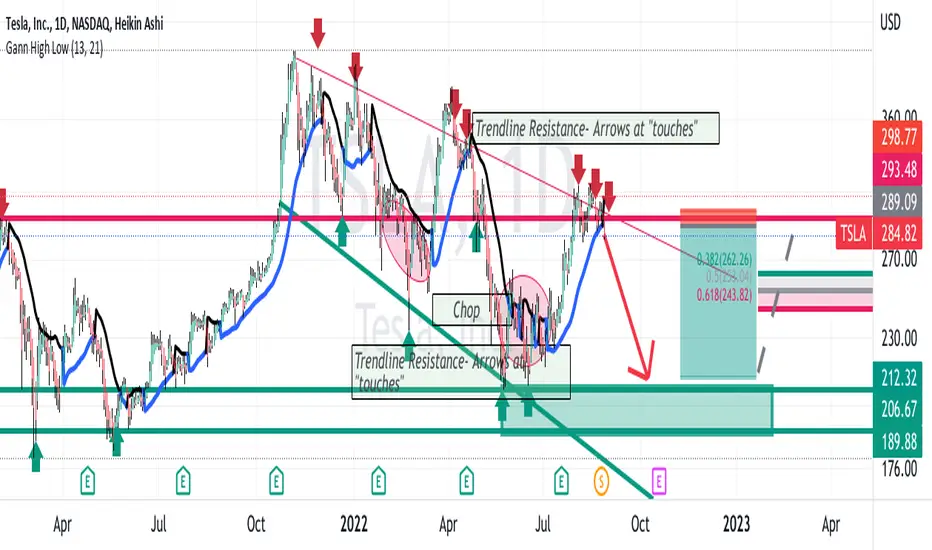
TSLA on the daily chart has a megaphone pattern showing increasing volatility as the price action is downward.
Supportive and resistance trendlines are touched multiple times. At present, the price is also at a horizontal S/R line being the 2021 year high.
Another horizontal line is the double bottom of Spring 2021 forming a support zone.
My analysis is that TLSA will downtrend from here heading down until the mid-Fibonacci
retracement levels and perhaps further to support zone at 188-208 and potentially lower
if short sellers aggressively gain directional momentum.
I have taken an out-of-the-money put option with a strike of $ 200 for October 21st mindful of the earnings date.
Trade active
TSLA down by 3% at the lunch session. the bear ETF - TSLQ is uptrending as the inverse,Note
TSLA down to finish out the week. Puts for 9/16 are up as is the bear ETF-Nothing to suggest a reversal of the downtrend right now
Disclaimer
The information and publications are not meant to be, and do not constitute, financial, investment, trading, or other types of advice or recommendations supplied or endorsed by TradingView. Read more in the Terms of Use.
Disclaimer
The information and publications are not meant to be, and do not constitute, financial, investment, trading, or other types of advice or recommendations supplied or endorsed by TradingView. Read more in the Terms of Use.