It’s been a punishing stretch for TWE holders, but price action has now pulled back into a critical zone where a relief rally could emerge. The broader trend remains bearish, so any positioning here must respect that context.
Key Support Factors
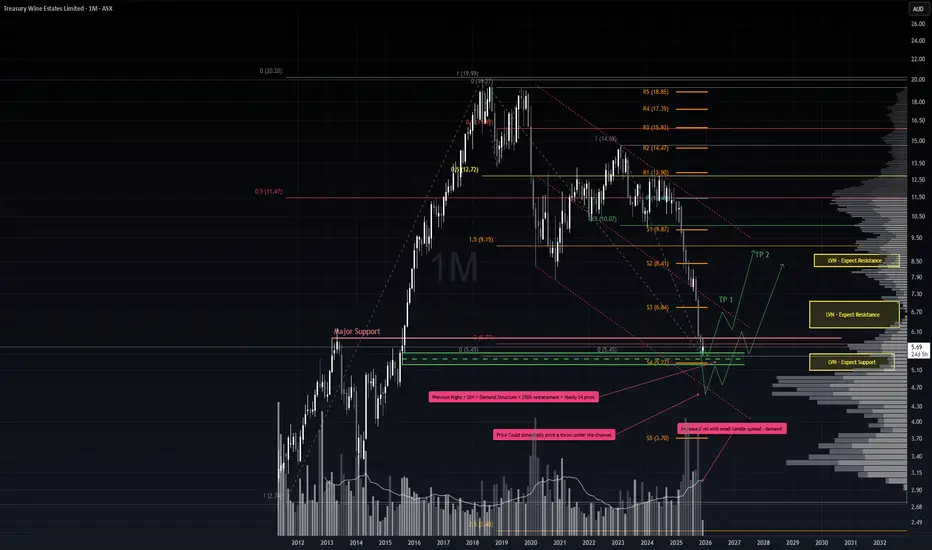
1. 200% retracement from the 2018 double top.
2. Low Volume Node (LVN) zone, indicating limited price acceptance and potential for sharp moves.
3. Demand structure anchored by the August 2015 candle.
4. Historical tops acting as structural support.
5. November monthly candle showed notable demand — high volume on a narrow spread.
6. 11 consecutive weeks down in a single swing, aligning with Gann’s 7–10 bar exhaustion principle.
7. Proximity to the yearly S4 pivot, reinforcing the demand zone.
Trade Scenario 1 – Aggressive Entry
Setup: Despite no confirmed trend reversal, risk-tolerant traders could begin scaling in here, supported by the confluence of demand factors.
Stop Loss: 5.22 — just beneath the demand structure and S4 pivot.
Take Profit: Initial target at the midline (EQ) of the downward channel. If price breaks cleanly above, extend targets toward the upper bounds of the channel.
Trade Scenario 2 – Throw-Under Reversal
Setup: If the S4 pivot and demand structure fail, watch for a throw-under pattern whereby price dips below support but quickly reclaims the range.
Confirmation: A bullish hammer or doji on surging volume, ideally accompanied by negative sentiment, would strengthen the reversal case.
Take Profit: Similar roadmap to Scenario 1 — first target at the channel EQ, then potentially the upper boundary if momentum builds.
Summary
This is a high-risk, counter-trend play. The confluence of structural supports, exhaustion signals, and pivot proximity offers a tactical window for relief. However, discipline around stops and scaling is essential, as the long-term bear market backdrop remains intact.
* Note, price pathing is not time based, just the overall price movement
Key Support Factors
1. 200% retracement from the 2018 double top.
2. Low Volume Node (LVN) zone, indicating limited price acceptance and potential for sharp moves.
3. Demand structure anchored by the August 2015 candle.
4. Historical tops acting as structural support.
5. November monthly candle showed notable demand — high volume on a narrow spread.
6. 11 consecutive weeks down in a single swing, aligning with Gann’s 7–10 bar exhaustion principle.
7. Proximity to the yearly S4 pivot, reinforcing the demand zone.
Trade Scenario 1 – Aggressive Entry
Setup: Despite no confirmed trend reversal, risk-tolerant traders could begin scaling in here, supported by the confluence of demand factors.
Stop Loss: 5.22 — just beneath the demand structure and S4 pivot.
Take Profit: Initial target at the midline (EQ) of the downward channel. If price breaks cleanly above, extend targets toward the upper bounds of the channel.
Trade Scenario 2 – Throw-Under Reversal
Setup: If the S4 pivot and demand structure fail, watch for a throw-under pattern whereby price dips below support but quickly reclaims the range.
Confirmation: A bullish hammer or doji on surging volume, ideally accompanied by negative sentiment, would strengthen the reversal case.
Take Profit: Similar roadmap to Scenario 1 — first target at the channel EQ, then potentially the upper boundary if momentum builds.
Summary
This is a high-risk, counter-trend play. The confluence of structural supports, exhaustion signals, and pivot proximity offers a tactical window for relief. However, discipline around stops and scaling is essential, as the long-term bear market backdrop remains intact.
* Note, price pathing is not time based, just the overall price movement
Trade active
Potentially, the throw‑under scenario is developing.The 17 December earnings downgrade triggered a sharp sell‑off, but the key detail is how quickly that move was absorbed by buyers, as reflected in the volume profile. Supply hit the tape, but it didn’t stick.
From here, the monthly close relative to the range becomes the main tell. A close back inside would reinforce the idea that the sell‑off was an exhaustion move rather than the start of a new leg down.
Stronger confirmation comes on a decisive close above 5.27, which would mark a structural reclaim and open the door for a more meaningful reversal.
Trade closed manually
The new yearly pivots have printed with S1 at $2.76 and the yearly pivot up at $7.05. Price is currently sitting in no‑man’s land, and the December candle didn’t close with the strength I wanted to see for continuation.We could still see a push toward the pivot before any rejection, but at this stage there are cleaner, higher‑quality setups across the ASX.
Disclaimer
The information and publications are not meant to be, and do not constitute, financial, investment, trading, or other types of advice or recommendations supplied or endorsed by TradingView. Read more in the Terms of Use.
Disclaimer
The information and publications are not meant to be, and do not constitute, financial, investment, trading, or other types of advice or recommendations supplied or endorsed by TradingView. Read more in the Terms of Use.