Here's the explanation.
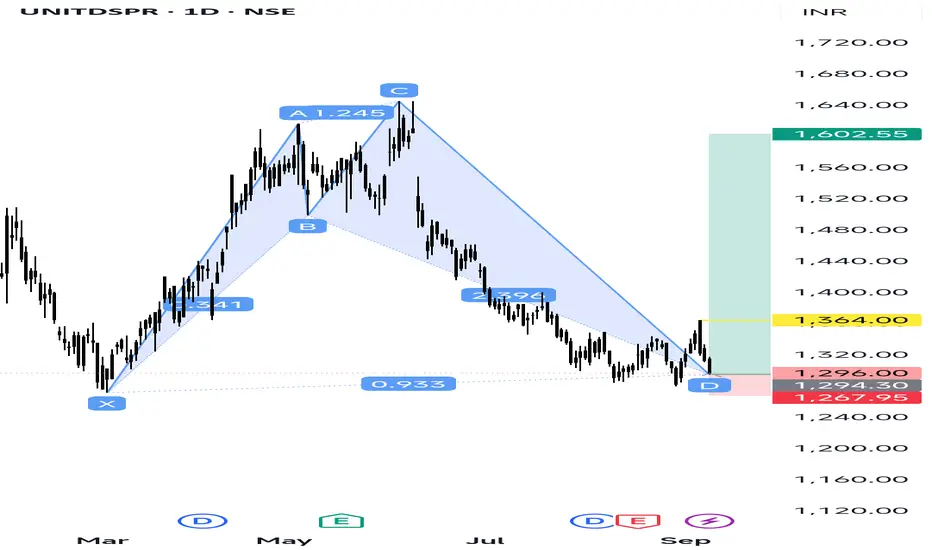
X to A: Initial strong rally.
A to B: Price retraced to ~0.886 of XA (fits Shark criteria).
B to C: A strong bullish move – extended to above 1.13 of AB.
C to D: A deep retracement, falling back close to 0.886–1.13 zone of XA → forming the Potential Reversal Zone (PRZ).
Now, the price is sitting around D (1296), which is the completion zone.
---
🔹 Trading Plan (General)
1. Entry:
Around Point D (1290–1300 zone) if reversal signs (bullish candles, RSI divergence, volume support) are visible.
2. Targets:
T1 → 1364 (first resistance / yellow line on chart)
T2 → 1500–1520
T3 → 1602 (green zone marked)
3. Stop Loss:
Below 1267 (red zone marked). If price closes below, pattern fails.
Disclaimer
The information and publications are not meant to be, and do not constitute, financial, investment, trading, or other types of advice or recommendations supplied or endorsed by TradingView. Read more in the Terms of Use.
Disclaimer
The information and publications are not meant to be, and do not constitute, financial, investment, trading, or other types of advice or recommendations supplied or endorsed by TradingView. Read more in the Terms of Use.