$NDX #nasdaq100 same Divergence with RSI from January
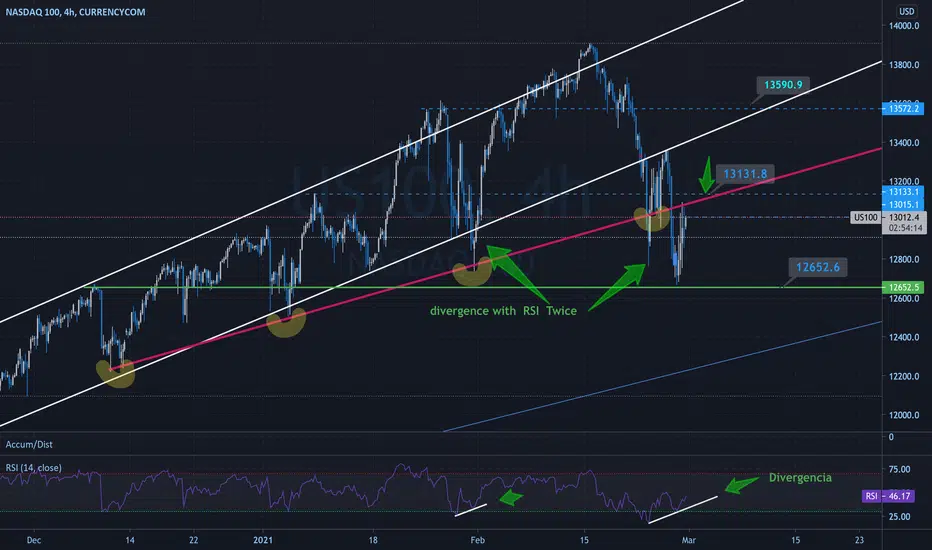
4h hours Chart is showing a divergence with the Relative Strength Index...
what do u think? bull or bear? NDX
NDX
what do u think? bull or bear?
Disclaimer
The information and publications are not meant to be, and do not constitute, financial, investment, trading, or other types of advice or recommendations supplied or endorsed by TradingView. Read more in the Terms of Use.
Disclaimer
The information and publications are not meant to be, and do not constitute, financial, investment, trading, or other types of advice or recommendations supplied or endorsed by TradingView. Read more in the Terms of Use.