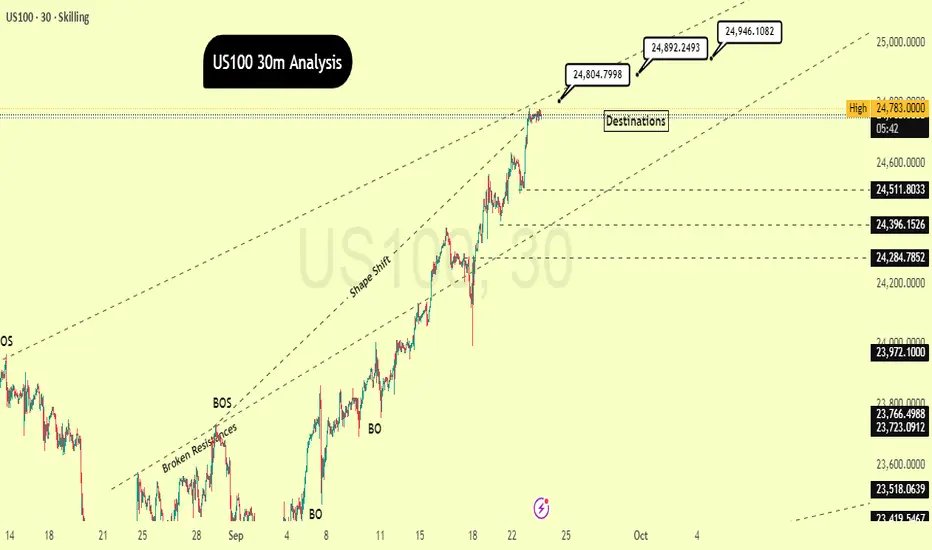
By scrutinizing the US100 chart on the30-minutes timeframe, it's evident that the price has initiated a powerful uptrend after surmounting several resistance zones. This is substantiated by the explicit "BOS" (Break of Structure) points, signaling that the market is consistently forging new, higher peaks. The "Shape Shift" noted on the chart indicates a transformation in market character, transitioning from a period of consolidation or a downtrend into a fresh, vigorous bullish impulse.
The price is currently nearing a pivotal resistance point around 24,783.0000. Should the price manage to breach and maintain a position above this threshold, we can anticipate a continuation of the upward trajectory. The prospective targets, labeled as "Destinations," are, 24804.7998, 24,892.2493 and , with an additional high-level objective at 24,946.1082.
I'd appreciate it if you could show your support through likes and comments to encourage me to share more analysis with you, and please share your perspective on the potential direction of this chart with me!
With Respect:
SimarEdgeTrading
Disclaimer
The information and publications are not meant to be, and do not constitute, financial, investment, trading, or other types of advice or recommendations supplied or endorsed by TradingView. Read more in the Terms of Use.
Disclaimer
The information and publications are not meant to be, and do not constitute, financial, investment, trading, or other types of advice or recommendations supplied or endorsed by TradingView. Read more in the Terms of Use.