📈 US100 – Likely Bullish Gap at Open Followed by a Sharp Drop 📉
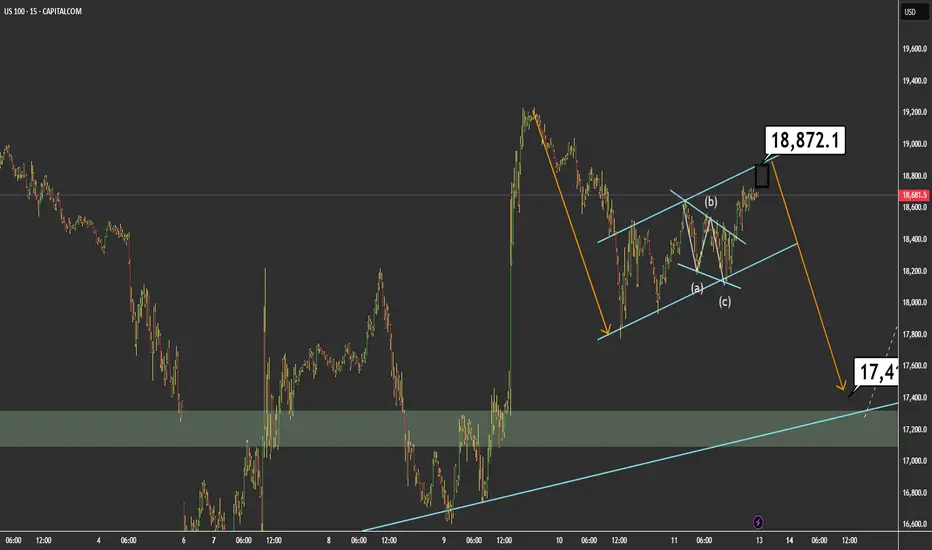
On the 15-minute chart of the US100, we can see a corrective structure forming within an ascending channel, likely representing wave (B) of a larger correction. The price is currently near the top boundary of the channel, around 18,872.1.
🔍 Key Technical Highlights:
Clear prior bearish impulse.
Ongoing corrective move within a rising channel.
ABC correction forming inside the channel.
Potential rising wedge, suggesting bullish exhaustion.
📌 Main Hypothesis: I expect the market to open with a bullish gap, potentially reaching or briefly exceeding the 18,872.1 level, before starting a stronger downward move toward 17,411.8, which aligns with a key support zone and broader trendline confluence.
📊 Key Levels:
Resistance: 18,872.1 (ideal reversal area)
Target Support: 17,411.8
⚠️ Alternative Scenario: A strong breakout and consolidation above the channel could invalidate the bearish setup and suggest a continuation to the upside.
💡 Conclusion: This move would fit well within a broader corrective pattern, offering a technical pullback before any potential continuation. I’ll be watching the open closely for confirmation.
💼 Trade Idea:
🔹 Strategy: Short from resistance
🔹 Suggested Entry: 18,850 – 18,880 (potential gap zone and upper channel resistance)
🔹 Stop Loss: Above 18,920 (outside channel and above recent highs)
🔹 Take Profit: 17,500 – 17,450 (key support zone / technical target)
🔹 Risk/Reward Approximation: 1:4
🧠 Wait for price action confirmation (rejection, bearish engulfing candle, or intraday structure break before entering).
Note
Note
Note
Note
Note
Disclaimer
The information and publications are not meant to be, and do not constitute, financial, investment, trading, or other types of advice or recommendations supplied or endorsed by TradingView. Read more in the Terms of Use.
Disclaimer
The information and publications are not meant to be, and do not constitute, financial, investment, trading, or other types of advice or recommendations supplied or endorsed by TradingView. Read more in the Terms of Use.