US30 (DOW): Equal Leg Projection Meets Fibonacci - Long Setup
Sharing my outlook on the Dow, which aligns with my NASDAQ analysis but with a specific mathematical approach. 📊
**🎯 The Setup:**
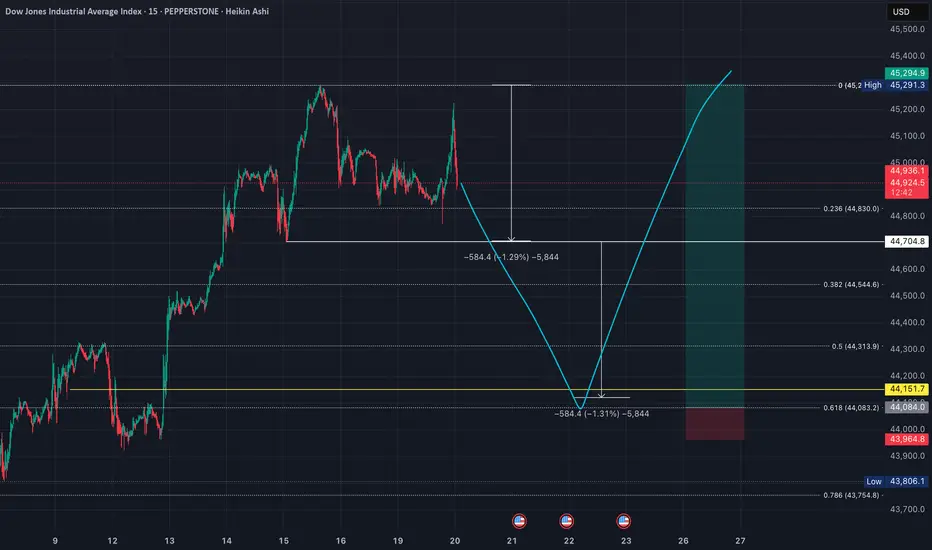
I'm targeting a long position based on an equal leg projection. Taking the range from the recent low to the all-time high, I expect a decline equal to that same distance. This projection perfectly coincides with the 0.618 Fibonacci level - a powerful confluence. 🎯
**📍 Entry Strategy:**
The beauty of this setup is the mathematical precision: the equal leg down from the high lands exactly at the 0.618 Fib level. This confluence gives me high confidence in this support zone for a potential long entry. ✅
**⚠️ Risk Management:**
Stop loss would be placed below the projected low, targeting new all-time highs. Clean entry, clear invalidation level. 🛑
**🧠 Why This Works:**
Equal leg projections are powerful tools in market analysis. When combined with key Fibonacci levels, they create high-probability reversal zones. The market often respects these mathematical relationships. 📐
**🔄 Bigger Picture Alignment:**
This setup aligns with my broader market view - expecting one final push higher before any significant correction. The Dow's equal leg projection gives us a precise entry point for this bullish thesis. 📈
**💡 Key Insight:**
When geometric projections align with Fibonacci levels, it creates what I call "mathematical harmony" in the markets. These setups often provide the best risk-adjusted opportunities. 🎵
📈 **This trade setup offers a risk-to-reward ratio of 10:1.** Without including fees, the breakeven win rate for this trade would be approximately 9.09%. Knowing these figures in advance helps me avoid emotional trading. 🧠
💡 **Pro Tip**: If you often find yourself trading based on emotions, I recommend doing this type of pre-planning and quantifying your setups before execution — it can be a simple yet highly effective improvement. ✅
---
**Trading is simple.** You don't need multiple indicators or dozens of lines on your chart. A clean and simple chart often works best — it keeps your decisions consistent and reduces uncertainty. Sure, it might not look flashy, and my analysis may seem a bit "plain" compared to others… but that's how I like it. If you find this analysis useful, feel free to follow me for more updates.
---
*Disclaimer: This post is for general informational and educational purposes only. It does not constitute financial advice, investment recommendation, or a service targeting specific investors, and should not be considered illegal or restricted information in any jurisdiction.*
**🎯 The Setup:**
I'm targeting a long position based on an equal leg projection. Taking the range from the recent low to the all-time high, I expect a decline equal to that same distance. This projection perfectly coincides with the 0.618 Fibonacci level - a powerful confluence. 🎯
**📍 Entry Strategy:**
The beauty of this setup is the mathematical precision: the equal leg down from the high lands exactly at the 0.618 Fib level. This confluence gives me high confidence in this support zone for a potential long entry. ✅
**⚠️ Risk Management:**
Stop loss would be placed below the projected low, targeting new all-time highs. Clean entry, clear invalidation level. 🛑
**🧠 Why This Works:**
Equal leg projections are powerful tools in market analysis. When combined with key Fibonacci levels, they create high-probability reversal zones. The market often respects these mathematical relationships. 📐
**🔄 Bigger Picture Alignment:**
This setup aligns with my broader market view - expecting one final push higher before any significant correction. The Dow's equal leg projection gives us a precise entry point for this bullish thesis. 📈
**💡 Key Insight:**
When geometric projections align with Fibonacci levels, it creates what I call "mathematical harmony" in the markets. These setups often provide the best risk-adjusted opportunities. 🎵
📈 **This trade setup offers a risk-to-reward ratio of 10:1.** Without including fees, the breakeven win rate for this trade would be approximately 9.09%. Knowing these figures in advance helps me avoid emotional trading. 🧠
💡 **Pro Tip**: If you often find yourself trading based on emotions, I recommend doing this type of pre-planning and quantifying your setups before execution — it can be a simple yet highly effective improvement. ✅
---
**Trading is simple.** You don't need multiple indicators or dozens of lines on your chart. A clean and simple chart often works best — it keeps your decisions consistent and reduces uncertainty. Sure, it might not look flashy, and my analysis may seem a bit "plain" compared to others… but that's how I like it. If you find this analysis useful, feel free to follow me for more updates.
---
*Disclaimer: This post is for general informational and educational purposes only. It does not constitute financial advice, investment recommendation, or a service targeting specific investors, and should not be considered illegal or restricted information in any jurisdiction.*
Order cancelled
The overall situation looks much worse than expected, so I canceled my orders for now.Disclaimer
The information and publications are not meant to be, and do not constitute, financial, investment, trading, or other types of advice or recommendations supplied or endorsed by TradingView. Read more in the Terms of Use.
Disclaimer
The information and publications are not meant to be, and do not constitute, financial, investment, trading, or other types of advice or recommendations supplied or endorsed by TradingView. Read more in the Terms of Use.