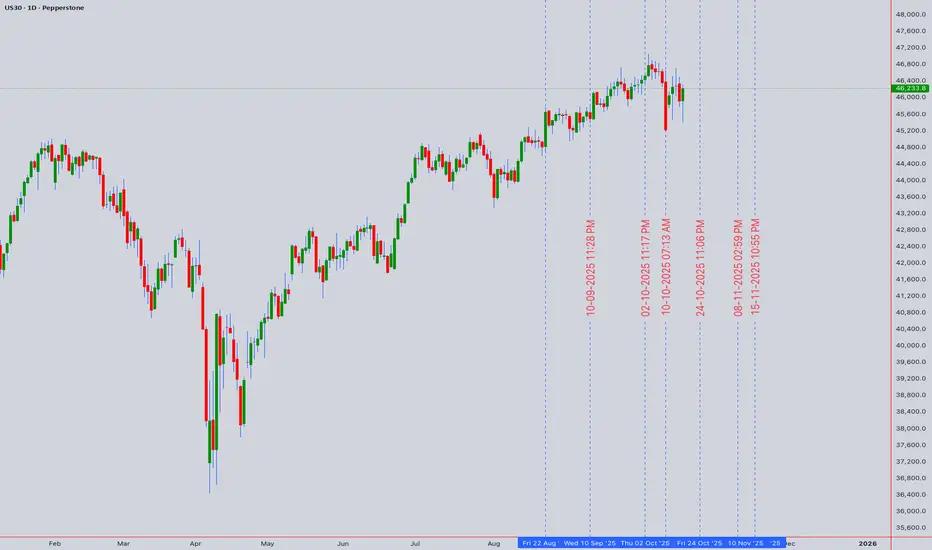
The US30 consolidates near a significant technical inflection point at 46,233.8. Our multi-timeframe analysis reveals a battle between bullish structure and emerging bearish divergences.
📊 Multi-Timeframe Synthesis & Market Structure
Daily (Trend Bias): The primary trend remains bullish above the key support confluence of 45,800 (50 EMA & Rising Trendline). However, price is testing the lower boundary of a bullish channel. A break below 45,800 would signal a deeper correction towards 45,200.
4H & 1H (Swing Setup): The index is forming a potential Bearish Rising Wedge. RSI on the 4H chart shows a clear bearish divergence, indicating weakening momentum. This is a cautionary sign for swing bulls.
Intraday (15M/5M - Precision): Price is trapped between immediate resistance at 46,450 and support at 46,100. The 5M chart shows Anchored VWAP (from yesterday's low) acting as dynamic resistance. A break below 46,100 targets 45,950.
🧠 Key Technical Narratives & Theories
Elliott Wave & Wyckoff: The pullback from the recent high exhibits characteristics of a Wave 4 correction or a Wyckoffian re-distribution phase. Volume analysis on breakdowns will be key.
Gann Angle & Square of 9: Critical Gann support resides near 45,950-46,000. A decisive break below this zone opens the path for a move towards the next Gann square level near 45,500.
Ichimoku Cloud: On the 4H, price is hovering above the Kumo (cloud). The Tenkan-Sen (red line) is flat, indicating short-term equilibrium. A break below the cloud would be a strong bearish trigger.
⚖️ Momentum & Volume Assessment
RSI (14): Reading of 52 on the 1D, neutral but leaning bearish on lower timeframes with divergences.
Bollinger Bands (20): Price is pressing the middle band (20 SMA). A sustained break below it often signals a shift to a short-term bearish phase.
Anchored VWAP & Volume: Recent up-moves have occurred on declining volume, suggesting a lack of strong bullish conviction—a potential bull trap formation.
🛠️ Trade Plan & Levels
Swing Short Idea: Consider shorts on a break & close below 46,100 (15M), targeting 45,800 and 45,500. Stop loss above 46,550.
Intraday Long Idea: Only above 46,450 (with volume), targeting 46,700. Stop loss below 46,300.
Intraday Short Idea: On a rejection from 46,450 or break of 46,100, targeting 45,950.
💡 The Bottom Line
The US30 is at a critical decision point. The bullish trend is under threat until price reclaims 46,700. The weight of evidence from divergences and pattern formation favors a bearish breakdown in the short term. Risk is elevated; position size accordingly.
Disclaimer: This is technical analysis, not financial advice. Trade at your own risk.
I am nothing @shunya.trade
Disclaimer
The information and publications are not meant to be, and do not constitute, financial, investment, trading, or other types of advice or recommendations supplied or endorsed by TradingView. Read more in the Terms of Use.
I am nothing @shunya.trade
Disclaimer
The information and publications are not meant to be, and do not constitute, financial, investment, trading, or other types of advice or recommendations supplied or endorsed by TradingView. Read more in the Terms of Use.