CADJPY Potential UpsidesHey Traders, in today's trading session we are monitoring CADJPY for a buying opportunity around 107.600 zone, CADJPY is trading in an uptrend and currently is in a correction phase in which it is approaching the trend 107.600 support and resistance area.
Trade safe, Joe.
Bullish Patterns

Gold is nearing the retrace area.Hey Traders, In today's session we’re closely monitoring Gold for a potential buying opportunity around the 2655 zone. The price has broken through the 2655 resistance and is now in a corrective phase, approaching a key retracement area.
Stay vigilant and trade wisely!
– Joe

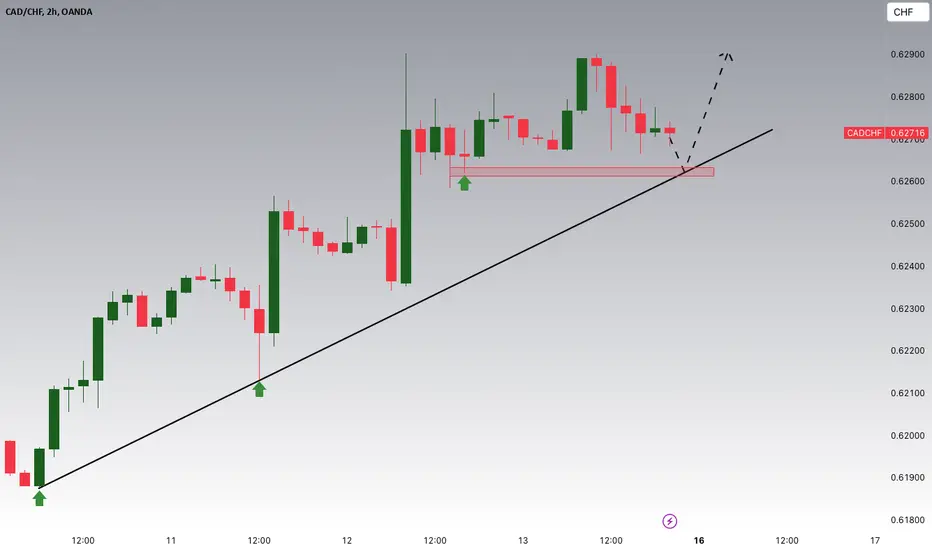
CADCHF Potential UpsidesHey Traders, in the coming week we are monitoring CADCHF for a buying opportunity around 0.62600 one, CADCHF is trading in an uptrend and currently is in a correction phase in which it is approaching the trend at 0.62600 support and resistance area.
Trade safe, Joe.
Is DXY Heading Above Previous High?Hey Traders, in today's trading session we are monitoring DXY for a buying opportunity around 106.800 zone, DXY is trading in an uptrend and currently is in a correction phase in which it is approaching the trend at 106.800 support and resistance area.
Trade safe, Joe.

USDCHF Is Nearing An Important Support With CHF WeaknessHey Traders, in today's trading session we are monitoring USDCHF for a buying opportunity around 0.88650 zone, USDCHF is trading in an uptrend and currently is in a correction phase in which it is approaching the trend at 0.88650 support and resistance area.
Trade safe, Jie.

USDJPY Potential UpsidesHey Traders, in today's trading session we are monitoring USDJPY for a buying opportunity around 152.500 zone, USDJPY is trading in an uptrend and currently is in a correction phase in which it is approaching the trend at 152.500 support and resistance area.
Trade safe, Joe.

How far ETH will pull back? Potential Future PathIn this chart, all bull trends are in green and bear trends in red, the the longer/ more tested, the stronger the line.
-The dark red line in the bottom corner was a descending trend we had since over a year ago
-We broke out and established a strong ascending trendline and an ascending channel that was about 15 degrees lower slope. And actually at the same time it confirmed the upward channel, it started the downward channel, recently confirmed.
-The other battle here is we lost that strong dark dark green ascending support line and then we came back up and took it back, got rejected and then tried numerous more times to break it before giving up and losing ground.
* Once again we will need to decide which channel we want to maintain, the ascending green channel or the newly formed descending red channel
* I drew some lines of what seems Potential Future Paths, based on my interpretation of the current chart
*Each set of eyes are where you want to be paying attention should we make it to this area.
Roughly this chart infers.
Possible downside
ETH: $3650-$3550 | bullish | If we maintain this green Ascending channel
ETH: ~$3450 | Possible short term bear
Possible Upside:
Look for resistance around $3950 after testing channel bottom.
-------------------------------------
Orderbooks:
Currently orderbooks are strong but we did have the first significant dip in trader confidence we have had in a long minute with the recent sharp pullback but asks are back up to a very stable level. A recent uptick in in bids at 100% DOM, infers traders think there is some more pullback possible though this could be short lived. This is per coinmarketflow, using the new TV charts on ETH.
-------------------------------------
Longer Term:
Note, that is 1 hour candles, here is the same chart with 1d candles:
* Notice we are in a looong term ascending trend and we still have a ways before we test our theoretical top of channel but also there is a lot of room for this to fall, ETH could fall to $2500 in the next days to months and it would still be in an overall longterm ascending pattern with numerous proofs of support over the years.
This is my research based on trend analysis and orderbooks. You should always do your own research, maybe my research will help add to your own and work out as a win.

NASDAQ Potential UpsidesHey Traders, in today's trading session we are monitoring NAS100 for a buying opportunity around 21700 zone, NASDAQ is trading in an uptrend and currently is in a correction phase in which it is approaching the trend at 21700 support and resistance area.
Trade safe, Joe.

NOSUSDT 4H: Ascending Triangle Breakout with Cup FormationNosana (NOS) has established a strong ascending trendline dating back to its earlier price action, demonstrating consistent higher lows. What's particularly interesting is the recent price action forming what appears to be a Inverse Head & shoulders pattern (marked by the blue curved line) right along the support of the ascending trendline while being in bigger Cup&Handle pattern (marked by yellow).
Key Technical Observations:
The current setup shows multiple bullish signals working in harmony:
The ascending trendline has served as reliable dynamic support with multiple confirmations
The cup formation suggests accumulation, with price now attempting to complete the pattern
The recent consolidation near the trendline indicates strong buying pressure at support levels
Price Targets:
The initial target based on the chart pattern projects to around 4.39, with potential for extension to 7.30 if momentum maintains. These targets align with the overall trend structure and previous resistance levels.
Trading Strategy Considerations:
Entry opportunities present themselves on either a bounce from the ascending trendline or a confirmed breakout above the cup formation. The ascending nature of support provides clear invalidation levels for risk management.
Risk Management:
Place stops below the ascending trendline, as a break below would invalidate the bullish setup.

PLUG Powering Up For A Breakout?!Here I have NASDAQ:PLUG on the Daily Chart!
We can see that Monday, November 4th gave us a Very Bullish break to the Falling Resistance Price has been contained by forming the Wedge Pattern and with the Bullish Volume following the Break, gives this pattern a Bullish Bias after the strong decline since Jan. 2021.
The push for Greener and Cleaner way of Living and Transportation has the world in High Search for Electric Alternative means of fuel and along the pathway of Lithium and Rare Earth Metals is a new theory of Hydrogen powered Fuel Cells!
Currently Price is at $2.52, struggling with a Local Resistance Level after Price reached a new 4-Year Low @ $1.60, close to All Time Low @ .1155 visited in Jan. 2013. With the tight consolidation underneath the Falling Resistance followed with a Break candle and Close candle Above of the Falling Resistance, Confirms a Valid Break of said Falling Resistance and indicates Bullish Sentiment entering the market.
-Now, we must wait to see if Price decides to retest the Break of Falling Resistance around ( $2.25 - $2.20 ) and if Supported successfully, would generate a great Buying Opportunity!
-If Price does found Support here, I suspect Price we will run into Resistance @ ( $3.55 - $ 3.22 ) then will aim for the Fair Value Gap formed @ ( $5.58 - $5.14 )
Indicators:
- RSI Crossing 50
- Large Bullish Volume

CHZ/USDT 1H: Descending Wedge Pattern - Bullish Breakout SetupCHZ is currently forming a descending wedge pattern, which is typically a bullish reversal pattern when formed in a downtrend. The price has been making lower highs and lower lows within the wedge, but the convergence of the trendlines suggests a potential breakout is approaching.
Key Technical Observations:
The primary trend shows a strong upward movement followed by a corrective phase within the descending wedge. The upper trendline connects multiple lower highs, while the lower trendline connects the lower lows, creating a clear convergence. The pattern started forming after reaching a local high, and the price has been consolidating with decreasing volatility, which often precedes a significant move.
Price Targets:
Given the height of the wedge and volatility principles:
1. Initial target: 0.14000 (previous resistance level)
2. Secondary target: 0.16000 (based on previous swing high)
3. Extended target: 0.18996 (projection based on the full previous move)
Trading Setup:
- Entry Conditions: Wait for a decisive breakout above the upper trendline (currently around 0.12000) with increased volume
- Initial Stop Loss: Place below the most recent swing low at 0.10500
- Take Profit Levels:
1. First TP at 0.14000
2. Second TP at 0.16000
3. Final TP at 0.18996
Risk Management:
- Stop Loss Placement: Below the wedge's lower trendline to maintain pattern validity
- Position Scaling: Consider entering 50% position on initial breakout, add 25% on first retest of breakout level, final 25% after confirmation
- Market Conditions to Watch: Overall crypto market sentiment, Bitcoin's price action, and trading volume
Additional Considerations:
The decreasing volume within the wedge supports the pattern's validity. A sudden increase in volume during breakout would provide additional confirmation of the setup.
Trade Validation:
- Bullish case: Break above 0.12000 with strong volume
- Invalidation: Break below the lower trendline or 0.10000 support level
- Pattern timing: Expect resolution within the next 24-48 hours based on wedge convergence

ALGOUSDT 2H: Descending Wedge Breakout - Bullish ContinuationThe ALGO/USDT pair has formed and broken out of a descending wedge pattern, which is typically a bullish continuation pattern. The price action shows a clear upward momentum after breaking the upper trendline resistance, suggesting the potential start of a new upward movement.
Key Technical Observations:
The primary trend had been bullish before entering the wedge consolidation, with price making higher lows during the broader uptrend. Within the wedge, we saw contracting volatility with lower highs and lower lows, but the breakout occurred with increased momentum. Support has formed around the 0.464 level, which previously acted as resistance, demonstrating a successful support/resistance flip.
Price Targets:
1. Initial target: 0.6054 (previous resistance level)
2. Extended target: 0.7398 (projection based on the previous upward movement)
Trading Setup:
- Entry Conditions: Price has already broken above the descending wedge resistance and shown initial confirmation. Current price at 0.4374 offers an entry opportunity with the trend.
- Initial Stop Loss: Place below the recent swing low at 0.4200, providing adequate room for normal market volatility
Risk Management:
- Stop Loss Placement: Below the wedge pattern's support trend line to invalidate the setup
- Position Scaling: Consider entering 50% position now and adding 25% at each retest of broken resistance
- Market Conditions to Watch: Overall crypto market sentiment and Bitcoin's price action
Additional Considerations:
The breakout is occurring with increasing volume, which adds credibility to the move. The prior uptrend's strength suggests this continuation pattern could have significant upside potential.
Trade Validation:
- Bullish Case: Sustained trading above 0.4400 with increasing volume
- Invalidation: Clean break below 0.4200 would negate the bullish setup
Market Context:
The crypto market has been showing signs of renewed strength, which supports the bullish case for ALGO. The clean break of the wedge pattern aligns with broader market dynamics, suggesting higher probability of success for this setup.

TOTAL3 2H: Bull Flag Formation - 1.6T TargetThe TOTAL3 index, representing the total cryptocurrency market capitalization excluding Bitcoin and Ethereum, is displaying a bullish continuation pattern in the form of a bull flag. The market has established a strong uptrend, followed by a consolidation period that appears to be setting up for another leg higher.
Key Technical Observations:
The primary trend is decisively bullish, with price action showing a steep ascent from around 600B to 1.14T market cap. The recent consolidation has formed a flag pattern, with parallel downward-sloping lines containing the price action. This type of consolidation after a strong move is typically a continuation pattern, suggesting the bullish momentum may resume. The volume profile during the consolidation appears to be diminishing, which is characteristic of flag patterns and supports the continuation thesis.
Price Targets:
Based on the measured move technique for flag patterns, taking the flagpole's height and projecting it from the breakout point, the primary target extends to approximately 1.6T. This projection aligns with the principle that crypto markets often extend previous moves after corrections. The target represents a significant psychological level that could act as a major resistance zone.
Trading Setup:
- Entry Conditions: Look for a decisive break above the upper flag boundary at approximately 1.14T, preferably with increased volume
- Initial Stop Loss: Place below the lower flag boundary around 1.07T
- Take Profit Levels: Primary target at 1.6T, with potential intermediate resistance at 1.3T and 1.4T
Risk Management:
- Stop Loss Placement: The tight consolidation pattern allows for a relatively close stop loss, improving the risk-reward ratio
- Market Conditions to Watch: Monitor Bitcoin and Ethereum's price action as they can influence the broader market sentiment
Additional Considerations:
The current consolidation is occurring at all-time high levels for TOTAL3, suggesting strong underlying strength in the altcoin market. The clean technical pattern, combined with the strategic location of the consolidation, provides a favorable setup for continuation.
Trade Validation:
- Bullish Case: A high-volume breakout above 1.14T would confirm the pattern
- Invalidation: A decisive break below 1.07T would negate the immediate bullish setup
Market Context:
The altcoin market has shown significant strength relative to Bitcoin and Ethereum, indicating growing interest in the broader cryptocurrency ecosystem. This suggests potential capital rotation into alternative cryptocurrencies, which could support the bullish thesis.

MSTR 4H: Potential Breakout from Descending TrendlineMicroStrategy (MSTR) has been forming a descending trendline resistance since its recent peak around 520. The price has been consolidating near the trendline convergence point, showing signs of a potential breakout. Current price action suggests accumulation with higher lows forming.
Key Levels:
Major resistance: Descending trendline (currently ~410)
Current price: ~400
Trade Setup:
Looking for a confirmed breakout above the descending trendline with increased volume. A successful breach could signal the end of the current corrective phase and potential trend reversal.
Risk Management:
Place stops below recent swing lows. Watch for false breakouts and monitor Bitcoin correlation as it significantly influences MSTR's price action.

NZD/USD BUYERS WILL DOMINATE THE MARKET|LONG
Hello, Friends!
We are targeting the 0.592 level area with our long trade on NZD/USD which is based on the fact that the pair is oversold on the BB band scale and is also approaching a support line below thus going us a good entry option.
✅LIKE AND COMMENT MY IDEAS✅

GBPUSD Setup: Bullish Wave Structure & Fibonacci Buy ZoneThe GBPUSD has stabilised after a significant downward move. A completed bullish wave structure has emerged, with Wave 4 failing to break above Wave 3. This indicates a potential buying opportunity from the Fibonacci buy zone.
On the 15-minute chart, we can consider going long using the MSL pattern (Lower Low, Low of Day, Higher Low & Higher Close) as a confirmation signal.
Entry Point: 1.26303
Stop Loss: 1.2610
Target: 1.2710
Stay disciplined and manage your risk accordingly.

Cloudflare (NET) AnalysisCompany Overview:
Cloudflare NYSE:NET , a global leader in cybersecurity, content delivery networks (CDN), and edge computing, is well-positioned to capitalize on increasing digital transformation and growing demand for secure, efficient cloud infrastructure.
Key Growth Catalysts:
Strategic AI Partnerships 🤝
Cloudflare’s collaboration with Microsoft Azure enhances its AI infrastructure, fostering innovation and bolstering its competitive edge in enterprise cloud solutions.
Zero Trust Leadership in Cybersecurity 🔐
Cloudflare’s Zero Trust platform addresses growing enterprise needs amid rising cyber threats and increased remote work adoption.
Advanced threat intelligence and access controls make it a leader in next-gen cybersecurity solutions.
Edge Computing & IoT Opportunities 🌐
Edge computing solutions are experiencing strong adoption, fueled by:
Growing demand for 5G networks and the IoT revolution.
The edge computing market is projected to reach $87.3 billion by 2026.
Cloudflare’s focus on reducing latency and enhancing network efficiency positions it to capture market share.
Global Expansion & Untapped Markets 🌍
New data centers in underserved regions expand Cloudflare’s global reach, improving service delivery and unlocking revenue opportunities in untapped markets.
Investment Outlook:
Bullish Stance: We are bullish on NET above $90.00-$91.00, supported by strong positioning in AI, cybersecurity, and edge computing, coupled with robust global expansion strategies.
Upside Target: Our price target is **$145.00-$150.00

AUDNZD Potential UpsidesHey Traders, in today's trading session we are monitoring AUDNZD for a buying opportunity around 1.10200 zone, AUDNZD is trading in an uptrend and currently is in a correction phase in which it is approaching the trend at 1.10200 support and resistance area.
Trade safe, Joe.

USOIL Potential UpsidesHey Traders, in today's trading session USOIL for a buying opportunity around 69 zone, USOIL is trading in an uptrend and currently is in a correction phase in which it is approaching the trend at 69 support and resistance area.
Trade safe, Joe.

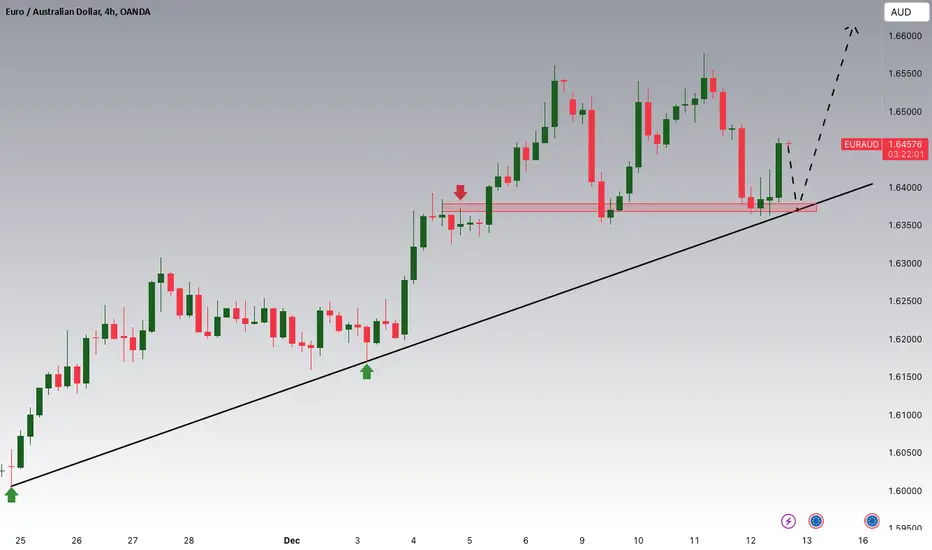
EURAUD Potential UpsidesHey Traders, in today's trading session we are monitoring EURAUD for a buying opportunity around 1.63700 zone, EURAUD is trading in an uptrend and currently is in a correction phase in which it is approaching the trend at 1.63700 support and resistance area.
Trade safe, Joe.
WIF Long Spot Trade (Consolidation Opportunity)Market Context:
WIF is currently consolidating in a favorable zone, offering an excellent opportunity to ladder into a long spot trade. With proper risk management and a clear upward target, this setup provides strong potential for upside continuation.
Trade Details:
Entry Zone: Around $2.90
Take Profit Targets:
First target: $3.50
Second target: $3.90
Stop Loss: $2.50
This trade setup presents a clear structure with defined risk and reward, aligning with current market conditions.

XRP bullish projection Looking at a bullish flag 🚩 formation once the brake out is confirmed that's when we wait for retest then long.

Bitcoin through next halving - on the cusp of a new cycleIf BTC makes a corrective move up and re-tests this region as support - this is what we think could happen. The tops/bottoms are never 100% accurate and change as market dynamics change - but this should give us a rough idea.
