Simple chart.
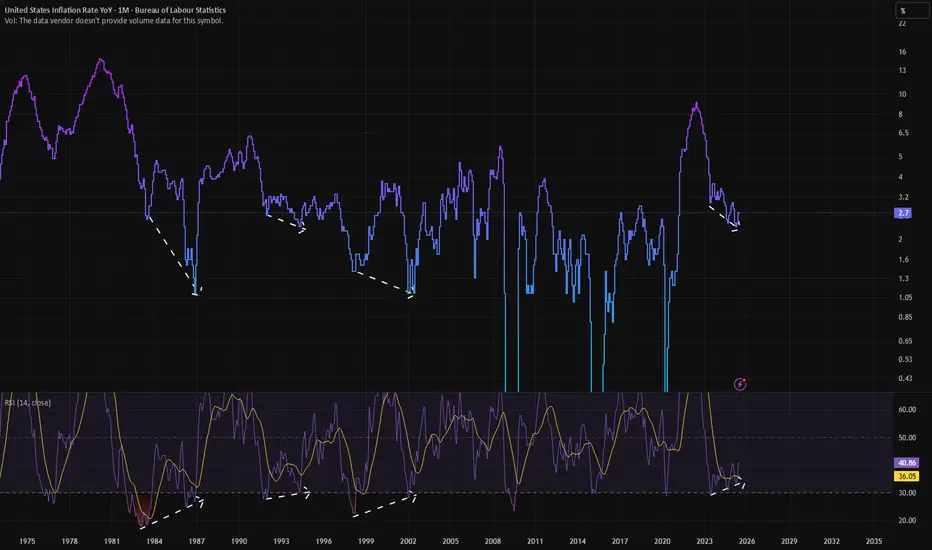
As you can see, US Inflation has often formed a bullish convergence pattern on it's derived RSI that has been a good predictor of several inflation bottoms.
We have one right now as you can see.
The problem is, that usually, inflation prints this signature when inflation is significantly below targets.
This time, inflation is printing ABOVE targets.
This means if inflation bounces here we can expect another burst of significantly above-target inflation.
Which, logically, means we should not expect rate cuts any time soon.
Either that, or we end up with a weak FED that won't do a U-turn on their rate cut plans, and they cut rates INTO an inflation bounce.
Which is obviously going to be a disaster.
Watch this chart carefully over the next few months going into Q4.
Disclaimer
The information and publications are not meant to be, and do not constitute, financial, investment, trading, or other types of advice or recommendations supplied or endorsed by TradingView. Read more in the Terms of Use.
Disclaimer
The information and publications are not meant to be, and do not constitute, financial, investment, trading, or other types of advice or recommendations supplied or endorsed by TradingView. Read more in the Terms of Use.