WTI Crude Oil Monthly Technical Outlook: Below $60 and the Broader Market Implications
As the fourth quarter of 2025 unfolds, the WTI Crude Oil (USOIL) chart offers a critical perspective on the state of global supply-demand balance and its broader impact on market sentiment. Trading near $58.5 per barrel, oil prices have fallen below a key psychological threshold, and while the move may seem technical at first, its implications reach far beyond the energy market.
The combination of weakening momentum indicators, rising supply projections, and softening global demand paints a nuanced but important story: oil’s slide below $60 is no longer just a chart event, it’s a macro signal about global growth, supply dynamics, and investor positioning.
Technical Overview: Momentum Loss Deepens
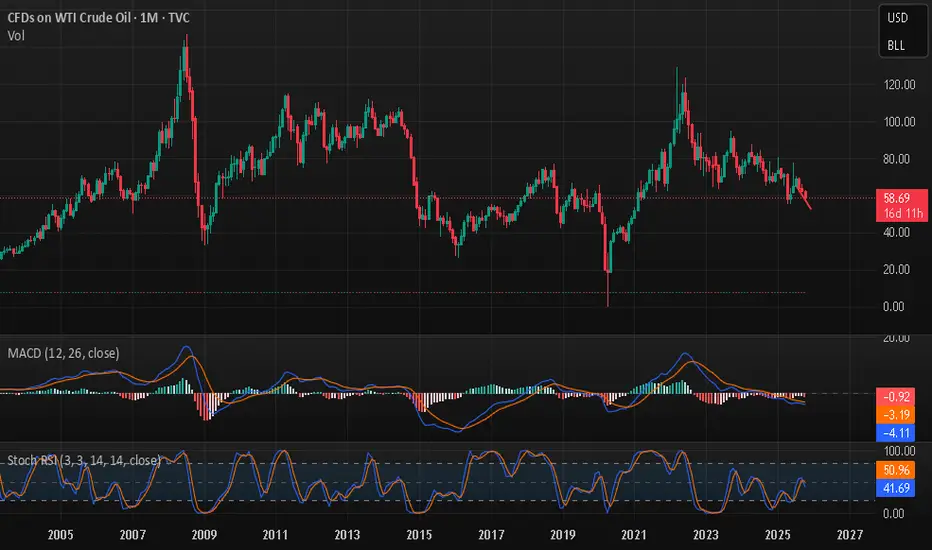
The monthly chart for WTI shows a clear picture of fatigue after multiple failed rebound attempts over the past 18 months. Since peaking near $130 in early 2022, prices have formed a persistent pattern of lower highs and lower lows, reflecting an extended process of distribution.
In recent months, WTI has failed to sustain moves above $70, with sellers consistently stepping in on rallies. The October bar extended losses toward the $58 level, marking the weakest monthly close since mid-2023.
Structurally, this decline puts WTI in a critical support zone between $55 and $57, which coincides with the base that previously stabilized prices in late 2023. Should this zone fail, the next major support rests around $50 per barrel, aligning with a key Fibonacci retracement of the 2020–2022 rally.
On the upside, the resistance band remains in the $65–$68 range, a descending trendline that has capped every rebound since early 2024. A decisive monthly close above that zone would be the first confirmation of renewed strength, but momentum indicators are still leaning toward continued weakness or sideways consolidation.
MACD and Stochastic RSI: Weakening Momentum Signals
The MACD (12,26,9) indicator remains subdued below the zero line, underscoring a prolonged loss of upside momentum. The histogram has recently turned red again, indicating that the MACD line may cross below the signal line, a potential confirmation that sellers still control the trend.
Meanwhile, the Stochastic RSI, which measures RSI velocity, has rolled over from midrange levels and is pointing lower again. Its failure to sustain a rebound above 50 shows that bullish energy has faded.
If this oscillator drops below 30, it would confirm a continuation of weak-to-neutral price action through the rest of Q4. Historically, such conditions precede prolonged consolidation phases, where volatility contracts before a new trend forms.
Together, these indicators portray a market not in full capitulation, but clearly lacking conviction for an upside breakout.
Fundamental Picture: Oversupply Meets Slowing Demand
While technical signals reveal a loss of momentum, the fundamental backdrop provides stronger clues about why oil has struggled to maintain value above $60. Recent data from major energy agencies, including the International Energy Agency (IEA), the U.S. Energy Information Administration (EIA), and multiple Reuters reports, converge on one central theme:
the global oil market is entering a surplus phase, with supply growth outpacing demand.
Large Oversupply Projections
Read full analysis on my website
darrismanresearch com
As the fourth quarter of 2025 unfolds, the WTI Crude Oil (USOIL) chart offers a critical perspective on the state of global supply-demand balance and its broader impact on market sentiment. Trading near $58.5 per barrel, oil prices have fallen below a key psychological threshold, and while the move may seem technical at first, its implications reach far beyond the energy market.
The combination of weakening momentum indicators, rising supply projections, and softening global demand paints a nuanced but important story: oil’s slide below $60 is no longer just a chart event, it’s a macro signal about global growth, supply dynamics, and investor positioning.
Technical Overview: Momentum Loss Deepens
The monthly chart for WTI shows a clear picture of fatigue after multiple failed rebound attempts over the past 18 months. Since peaking near $130 in early 2022, prices have formed a persistent pattern of lower highs and lower lows, reflecting an extended process of distribution.
In recent months, WTI has failed to sustain moves above $70, with sellers consistently stepping in on rallies. The October bar extended losses toward the $58 level, marking the weakest monthly close since mid-2023.
Structurally, this decline puts WTI in a critical support zone between $55 and $57, which coincides with the base that previously stabilized prices in late 2023. Should this zone fail, the next major support rests around $50 per barrel, aligning with a key Fibonacci retracement of the 2020–2022 rally.
On the upside, the resistance band remains in the $65–$68 range, a descending trendline that has capped every rebound since early 2024. A decisive monthly close above that zone would be the first confirmation of renewed strength, but momentum indicators are still leaning toward continued weakness or sideways consolidation.
MACD and Stochastic RSI: Weakening Momentum Signals
The MACD (12,26,9) indicator remains subdued below the zero line, underscoring a prolonged loss of upside momentum. The histogram has recently turned red again, indicating that the MACD line may cross below the signal line, a potential confirmation that sellers still control the trend.
Meanwhile, the Stochastic RSI, which measures RSI velocity, has rolled over from midrange levels and is pointing lower again. Its failure to sustain a rebound above 50 shows that bullish energy has faded.
If this oscillator drops below 30, it would confirm a continuation of weak-to-neutral price action through the rest of Q4. Historically, such conditions precede prolonged consolidation phases, where volatility contracts before a new trend forms.
Together, these indicators portray a market not in full capitulation, but clearly lacking conviction for an upside breakout.
Fundamental Picture: Oversupply Meets Slowing Demand
While technical signals reveal a loss of momentum, the fundamental backdrop provides stronger clues about why oil has struggled to maintain value above $60. Recent data from major energy agencies, including the International Energy Agency (IEA), the U.S. Energy Information Administration (EIA), and multiple Reuters reports, converge on one central theme:
the global oil market is entering a surplus phase, with supply growth outpacing demand.
Large Oversupply Projections
Read full analysis on my website
darrismanresearch com
Disclaimer
The information and publications are not meant to be, and do not constitute, financial, investment, trading, or other types of advice or recommendations supplied or endorsed by TradingView. Read more in the Terms of Use.
Disclaimer
The information and publications are not meant to be, and do not constitute, financial, investment, trading, or other types of advice or recommendations supplied or endorsed by TradingView. Read more in the Terms of Use.