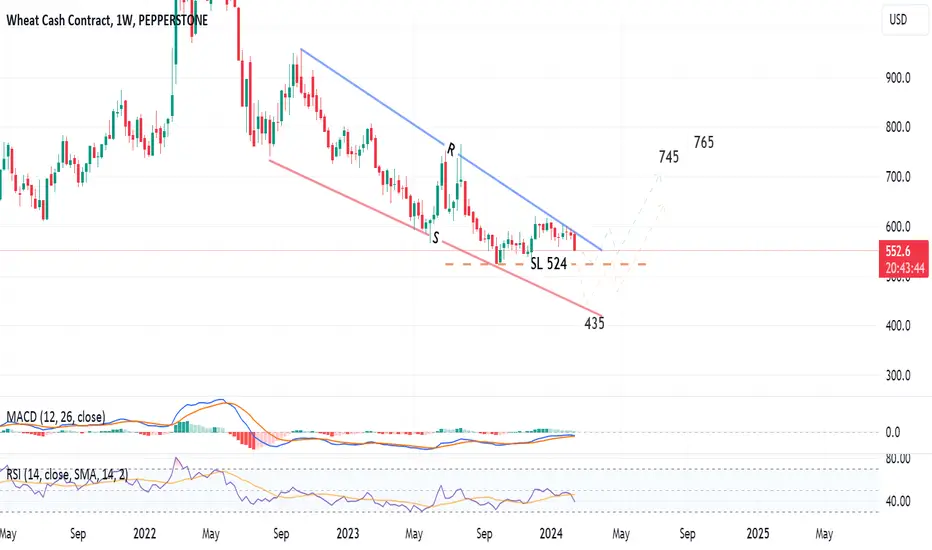
Weekly chart, wheat cash contract is trading in a falling wedge!
Will we see the 435 - 400 price level or rebound upwards from 520 - 525?
It is tough to confirm.. However, this falling wedge pattern has a higher probability that the price will cross the resistance (line R) upwards towards 745 and 765 in the long term.
Will we see the 435 - 400 price level or rebound upwards from 520 - 525?
It is tough to confirm.. However, this falling wedge pattern has a higher probability that the price will cross the resistance (line R) upwards towards 745 and 765 in the long term.
Disclaimer
The information and publications are not meant to be, and do not constitute, financial, investment, trading, or other types of advice or recommendations supplied or endorsed by TradingView. Read more in the Terms of Use.
Disclaimer
The information and publications are not meant to be, and do not constitute, financial, investment, trading, or other types of advice or recommendations supplied or endorsed by TradingView. Read more in the Terms of Use.