I'm sharing my expectations for Gold's movement this week. 📈
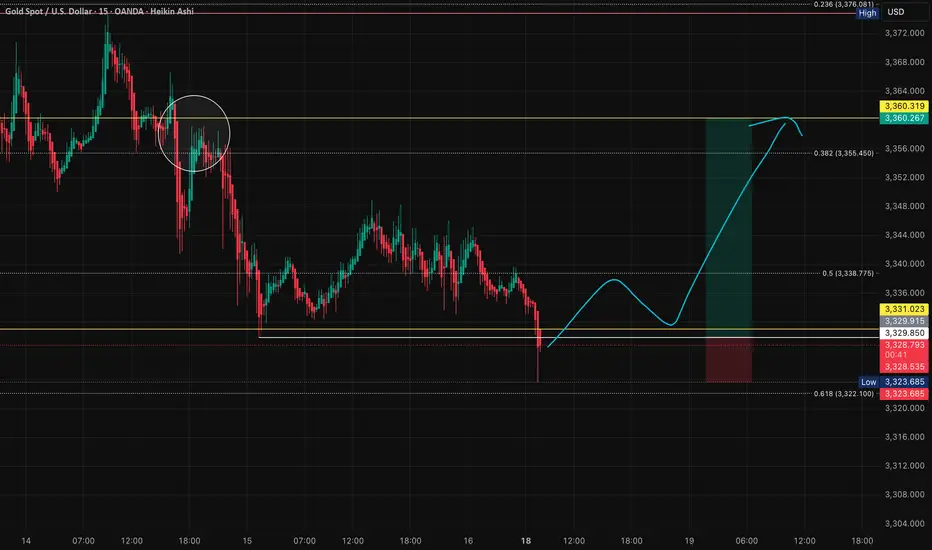
The lower yellow horizontal line shown below is a level that held strong twice last week. 💪 I expect this line to hold one more time, followed by a move up to the upper yellow horizontal line. The upper yellow line represents a zone where price repeatedly formed highs last week. 🔄
My thesis is that we'll likely see a move that sweeps the stop losses from the highs marked by the white circles. ⭕ These short-term stop losses often get triggered before price reverses in the opposite direction — a common market dynamic. 🔄
**📍 Entry Strategies:**
🟢 **Primary Setup**: The cleanest entry would be confirmation that the current price level holds, with the lower yellow horizontal line acting as support.
⚡ **Alternative Setup**: However, depending on how price develops, we might not see a clear role reversal pattern before the upward move begins. In that case, a stop entry above resistance would be preferable.
**⚠️ Risk Management:**
🛑 Regardless of entry method, if price breaks below the current low after entry, that's where I'd place my stop loss. When the thesis breaks, you cut the trade — that's my approach, at least.
❌ If we see the current low getting broken with continued downward momentum, the risk-to-reward ratio would deteriorate, and I'd skip the trade entirely. I typically target setups with at least a 5:1 risk-to-reward ratio, though each trader should determine their own minimum threshold. 🎯
📈 **This trade setup offers a risk-to-reward ratio of 5:1.** Without including fees, the breakeven win rate for this trade would be approximately 16.67%. Knowing these figures in advance helps me avoid emotional trading. 🧠
💡 **Pro Tip**: If you often find yourself trading based on emotions, I recommend doing this type of pre-planning and quantifying your setups before execution — it can be a simple yet highly effective improvement. ✅
---
**Trading is simple.** You don't need multiple indicators or dozens of lines on your chart. A clean and simple chart often works best — it keeps your decisions consistent and reduces uncertainty. Sure, it might not look flashy, and my analysis may seem a bit "plain" compared to others… but that's how I like it. If you find this analysis useful, feel free to follow me for more updates.
---
*Disclaimer: This post is for general informational and educational purposes only. It does not constitute financial advice, investment recommendation, or a service targeting specific investors, and should not be considered illegal or restricted information in any jurisdiction.*
Note
Breakout Setup: For a stop entry approach, I'd consider going long if price breaks back above the white line shown below. This would confirm upward momentum is building.Trade active
I entered using a stop order.Trade closed: stop reached
OMG.My stop loss got hit 😅
Just barely didn't reach the take profit. What a shame.
That said, I think there might be some useful reference points in how I used the stop order for entry. If you found it helpful, I'd appreciate a boost and follow 😎
Disclaimer
The information and publications are not meant to be, and do not constitute, financial, investment, trading, or other types of advice or recommendations supplied or endorsed by TradingView. Read more in the Terms of Use.
Disclaimer
The information and publications are not meant to be, and do not constitute, financial, investment, trading, or other types of advice or recommendations supplied or endorsed by TradingView. Read more in the Terms of Use.