1. Market Core Logic Analysis
News (Negative): Although the Federal Reserve cut interest rates by 25 basis points, Chairman Powell's comments were hawkish (no rush to ease policy and warning of inflation), cooling market expectations for aggressive rate cuts in the future. This move triggered a rebound in the US dollar and a rise in US Treasury yields, directly pressuring dollar-denominated gold, causing prices to surge (reaching a record high) before retreating.
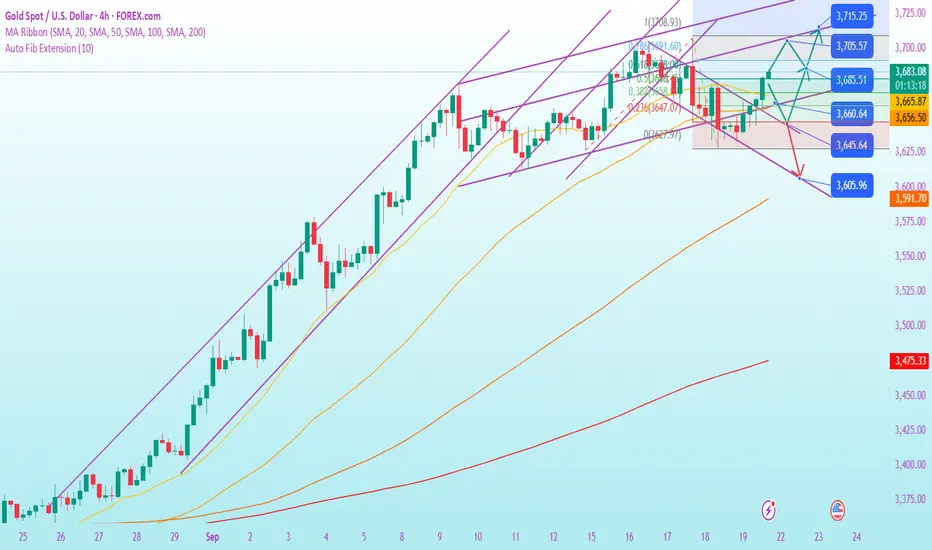
Technical Analysis (Bull-Bear Game): The daily chart showed two consecutive declines, the first time since the rally from 3311, indicating weakening short-term bullish momentum and a technical correction. However, the price remains above key trend support at 3615, indicating that the broader bullish trend has not been broken. The current decline should be viewed as a "high-level oscillation correction within the bullish trend."
2. Key Price Level Analysis
Upward Pressure:
Primary resistance: 3672-3675 (a high tested multiple times this week). This is the key dividing line between strength and weakness at the beginning of next week. If the rebound fails to break through this area, it indicates that bearish pressure remains and the market will fluctuate weakly.
Core resistance: 3707 (historical high). This is the strongest bastion for bulls to conquer. Until it effectively breaks through and holds, gold will struggle to gain new upside potential.
Downward Support:
Short-term support: 3643-3633. This is the first line of defense after the opening of next Monday. If it breaks below, it will retest this week's low.
Core Support: 3628 (this week's low) and 3615 (a key trend point). 3615 is the lifeline that determines the future market direction. If the price breaks below this level, it means that the current correction will deepen, potentially targeting the 3600 or even 3580 areas. If it can hold, the bullish trend will be secure.
3. Next Week's Trading Strategy and Layout
Key Strategy: Invest in dips on pullbacks to key support levels, and supplement with high-shorts on rebounds to strong resistance levels. Specific Operational Plan:
Low-to-Long Opportunities (Primary Strategy):
Ideal Entry Area: 3633-3643 (test long positions with a small position), or when the price falls back to 3628-3615 (focus on long positions).
Stop-Loss: Below 3610 (A break below the 3615 trend line invalidates the strategy and requires decisive exit).
Targets: First target 3660-3670, second target 3680-3690, ultimate target 3707.
Position Management: This strategy is a swing-trend strategy, aiming for profits from the continuation of the trend after a correction, requiring patience.
High-Level Short-Selling Opportunities (Secondary Strategy):
Ideal Entry Area: The first rebound of the price to the 3670-3675 resistance zone, if a clear resistance signal (such as a bearish candlestick pattern) appears.
Stop-Loss: Above 3680.
Target: 3650-3640 (short-term profit taking). Strategy: This is a short-term counter-trend strategy designed to capture profits during periods of volatility. Enter and exit quickly, and avoid lingering.
4. Market Forecast and Timing
Early Week: Focus on the opening price. If it opens below 3650, it will likely test the 3643-3633 support area, or even retest the 3628 low. Opportunities for dips and long positions can be sought after a pullback.
Mid-Week: Observe price reaction to support levels. If it stabilizes and rebounds, successfully breaking through the 3672-3675 resistance zone, the short-term weakness will reverse, and prices are expected to launch another push towards the 3700 level.
Weekend and Market Outlook: The correction may continue until the end of September. Closely monitor the defense of the key support level of 3615. As long as it remains above, the market correction is expected to end in early October, ushering in a new uptrend.
Summary and Risk Management Tips
Trend and Rhythm: Understand the relationship between long-term bullishness and short-term corrections. Don't assume that the trend is reversing because of a short-term decline, and don't ignore the strength of the adjustment. In terms of operation, we should follow the general trend (upward trend), but we need to grasp the rhythm of small cycles (small cycle fluctuations).
❤️Free gold trading signals:t.me/+OJSbWQ6F4KM2Mzk1
💥Gold trading analyst | Technology + logic dual drive
💯Intraday/band strategy analysis | Risk control first, win in stability
💥Gold trading analyst | Technology + logic dual drive
💯Intraday/band strategy analysis | Risk control first, win in stability
Related publications
Disclaimer
The information and publications are not meant to be, and do not constitute, financial, investment, trading, or other types of advice or recommendations supplied or endorsed by TradingView. Read more in the Terms of Use.