📊 The gold market is currently in a clear bullish phase. While prices may experience a technical correction after reaching a record high, the overall trend remains strong.
📈 Overview of Current Gold Trends
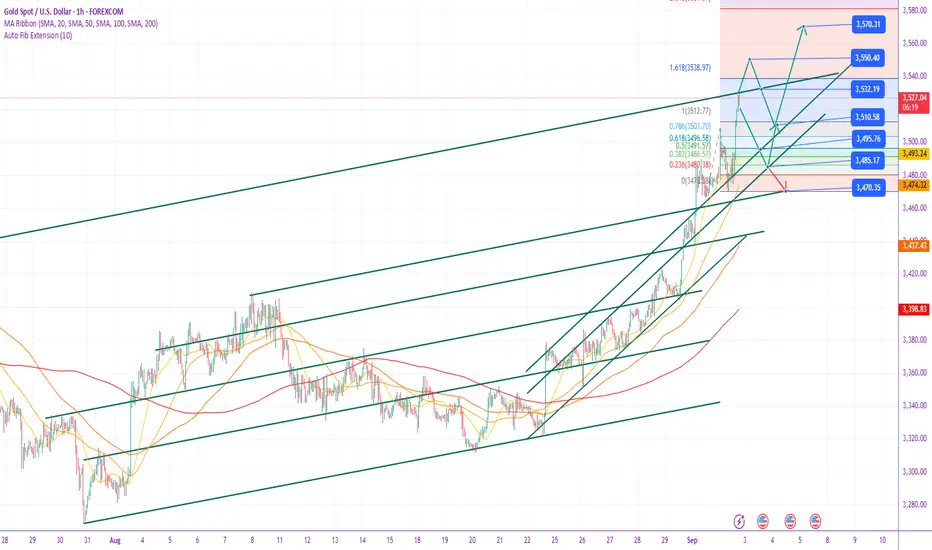
Trend Status: International gold prices (such as London spot gold) have broken through the $3,500/ounce mark, reaching a new record high. This marks the sixth consecutive trading day of gains for international spot gold prices.
Core Drivers:
Federal Reserve Rate Cut Expectations: Market expectations for a 25 basis point rate cut by the Federal Reserve in September have risen to nearly 90%, which is the most important factor driving gold prices recently. Historical data shows that within the 60 days following the start of a Fed rate cut cycle, gold prices have averaged an increase of approximately 6%.
Risk Aversion: Trump's dismissal of Federal Reserve Governor Lisa Cook has raised concerns about the Fed's independence. This, coupled with the Russia-Ukraine conflict, escalating tensions in the Middle East, and uncertainty surrounding US tariff policies, have all increased gold's safe-haven appeal.
Performance of the US dollar: Although the US dollar has rebounded moderately recently, it has not been able to effectively suppress the upward trend of gold prices.
📉 Key Technical Levels
Current resistance levels: $3530-3540 (short-term), $3570.
Current support levels: $3490-3480 (short-term), $3470-3460 (important support, a break below could lead to further decline), $3440-3450 (medium-term strength-weakness watershed, also a key resistance level previously broken that turned into support).
Technical indicator signals:
The daily chart shows a new high, the MACD double lines are in a golden cross, and the moving average cluster is bullish, indicating that bulls are still in control.
The RSI indicator is approaching slightly overbought territory, suggesting possible short-term consolidation or a small pullback. However, within a strong trend, overbought conditions are likely to persist.
🛠️ Trading Strategy Recommendations:
Primary Strategy (Buy on Pullback):
Entry Time: If the gold price pulls back to the $3490-3480 support area and stabilizes, or if it pulls back further to around $3470-3460 and a stop-loss signal appears.
Target: Initial target: $3530-3540, with a potential upside to $3570 or even higher after a breakout.
Secondary Strategy (Short on Rebound):
Entry Time: Only as a short-term counter-trend trade. If the gold price rises rapidly to the $3530-3540 or even $3570 resistance area and shows clear signs of stagflation (e.g., long upper shadows or divergences in technical indicators).
Target: $3500-3510.
Stop-loss: Set strictly above key resistance levels (e.g., $3550 or $3575).
Position Management and Risk Warning:
Avoid chasing rising and falling prices: Gold prices are currently at historical highs and volatility may increase. Try with a light position and deploy in batches: Long positions can be established in batches near key support levels to spread costs.
Adhere to strict stop-loss orders: Regardless of whether you are trading long or short, always set a stop-loss order to protect your principal.
💎 Summary
Gold is currently benefiting from the dual support of expectations of a Fed rate cut and safe-haven demand driven by geopolitical risks, and its medium- to long-term outlook remains positive. However, in the short term, due to technical signs of overbought conditions, be wary of high-level volatility and the risk of a pullback.
In terms of operations, the primary strategy is to buy on pullbacks, supplemented by short-term selling on rebounds. Arranging long positions after stabilization near key support levels is a relatively stable strategy. Be sure to operate with a light position, strictly set stop-loss orders, and pay close attention to how the upcoming US economic data will guide market sentiment.
Trade active
Latest Gold Trend Analysis Strategy for September 3rd:
I. Gold Market Overview
Price Dynamics: Spot gold broke through the historic $3,500/oz mark on September 2nd, reaching a high of $3,540/oz before closing at $3,533.40/oz, a single-day gain of over 1%. It fluctuated narrowly during the Asian and European trading sessions on September 3rd, trading between $3,526-3,546/oz.
Year-to-Date Performance: Gold has seen a cumulative increase of 34.5% since 2025, significantly outperforming other major asset classes, highlighting its safe-haven properties.
Core Drivers:
✅ Expectations of a Federal Reserve rate cut (probability of a September rate cut exceeds 85%);
✅ Weak US economic data (continuing manufacturing contraction, downward revision of employment data);
✅ Geopolitical and trade uncertainties (appeals against Trump's tariff policy, concerns about the Federal Reserve's independence);
✅ Continued global central bank gold purchases (global central banks increased their gold holdings by 166 tons in Q2 2025).
II. Technical Analysis
Trend Analysis:
The bullish pattern is intact, with a strong daily breakout above the previous high of 3508. The short-term target is $3650/oz.
Key Support and Resistance:
Support: 3526 (intraday bull-bear boundary) → 3508-3500 (concentrated support area) → 3475-3470 (last wave starting point).
Resistance: 3555-3560 (4-hour Bollinger Band upper limit) → 3600 (psychological barrier).
Momentum Signals:
RSI is overbought but not diverging, and the MACD golden cross continues. Be wary of a short-term technical correction.
Breakout Confirmation: If the weekly resistance of 3540 holds, upside potential could extend to $3560-3580.
Timeframe:
Non-farm payroll data (September 5) and the Federal Reserve interest rate decision (September 17) could be key turning points.
III. Trading Strategy Recommendations
Day Trading (September 3):
Key Strategy: Invest primarily on pullbacks, supplemented by shorting on rebounds.
Long Opportunities:
Long positions are established after the price stabilizes at the 3520-3510 support zone. Set a stop-loss below 3500 and target 3540-3550.
If the price holds above 3526, follow up with a small long position. Once it breaks through 3540, target 3555.
Short Opportunities:
Short positions are established when the price first reaches the 3555-3560 area. Set a stop-loss at 3565 and target 3530-3520.
If the price breaks below the 3526 support zone and rebounds to around 3538, a small short position can be established.
Risk Management Tips:
Strictly follow through with stop-loss orders (recommended single loss ≤ 2% of position).
Avoid chasing highs and monitor the fluctuation patterns during the US trading session .
IV. Key Risks
Upside Risks:
Non-farm payroll data below expectations (expected 93,000 new jobs), escalating geopolitical conflicts.
Downside Risks:
Strong employment data → reduced expectations for rate cuts;
A reversal of Trump's tariff policy or a hawkish Fed stance.
Core Logic: Concerns about the US dollar's credit system, diversified central bank reserves, and stagflation risks support gold's long-term value.
Summary
Gold is currently in a strong bull cycle, but in the short term, caution should be exercised against technical pullbacks before the non-farm payroll data. The operation is dominated by low-long, and the key support area (3500-3510) is regarded as an opportunity to arrange long orders, and the high altitude is limited to light positions at the resistance level. Medium- to long-term investors can take advantage of pullbacks to gradually build positions, focusing on Fed policy and evolving global risks.
Trade closed: target reached
Will gold prices continue to rise on September 4th?
I. Fundamental Analysis
Strong safe-haven demand
Weak US economic data (manufacturing has contracted for six consecutive months), trade policy uncertainty, and heightened global geopolitical risks are driving investors toward the safety of gold.
Expectations of a Federal Reserve rate cut have intensified (the market is betting on an over 80% probability of a September rate cut). The prospect of falling real interest rates is supporting long-term strength in gold prices.
The cumulative increase this year is 34.5%, significantly outperforming other assets, reflecting the market's concerns about systemic risks.
Key Event Risks
Non-farm payroll data (September 5th): If the employment data falls short of expectations, it could strengthen the case for a rate cut, further boosting gold prices.
Federal Reserve interest rate decision (September 17): If a dovish signal is released or an interest rate cut is implemented, gold prices may break through previous highs; if a hawkish surprise occurs, it may trigger a short-term correction.
II. Technical Analysis
Trend Structure
The bullish trend remains intact: Both the weekly and daily charts are in an ascending channel. A breakout from the end of the triangle consolidation could theoretically target the 3650 area.
Key Support and Defense Lines:
Short-term Support: 3545-3535 (Intraday Bull-Bear Divider)
Strong Support: 3505-3500 (Bulls' last line of defense; a break below indicates a weakening trend)
Resistance Area:
3555-3560 (4-hour Bollinger Band upper band)
3575-3585
Time Patterns and Trading Rhythm
Asian Session: Frequently sees a surge followed by a decline or oscillation; avoid chasing the ups and downs.
European session: Volatility narrowed, mostly building momentum for the US session.
US Session: Regularly strengthening over the past two weeks.
III. Comprehensive Trading Strategy
Key Strategy: Buy low and go long (follow the trend before it breaks), sell high and go short only as a counter-trend short-term strategy.
Specific Strategy:
Long Opportunities:
Buy lightly on pullbacks to 3540-3535, stop loss at 3525, target 3555-3560. If it falls to the 3505-3500 area, add to your long position with a stop-loss at 3495 and a target of 3550-3580.
Short Opportunities:
Test short positions on the first touch of 3575-3585 (strict stop-loss at 3590), with a target of 3550-3540.
If the Asia-Europe session falls below 3535, short sell when it rebounds to around 3540, with the target at 3520-3505.
Risk Management Tips:
Single stop-loss should not exceed 2% of principal, and positions should be halved before the non-farm payroll report.
If it breaks through 3585 strongly, the short selling order will be invalid, and the long position needs to wait for confirmation after a pullback.
IV. Key Notes:
Intraday data is light, but be wary of sudden geopolitical news disruptions.
If the US dollar index moves unexpectedly during the US trading session, adjust your positions flexibly.
❤️Free gold trading signals:t.me/+7W6lfjoqQ-Y2NjU0
🥇Gold price trend analysis and forecast
💹Technical analysis (K-line patterns, trend lines, indicator systems)
✅Gold's safe-haven properties and asset allocation strategy
🥇Gold price trend analysis and forecast
💹Technical analysis (K-line patterns, trend lines, indicator systems)
✅Gold's safe-haven properties and asset allocation strategy
Related publications
Disclaimer
The information and publications are not meant to be, and do not constitute, financial, investment, trading, or other types of advice or recommendations supplied or endorsed by TradingView. Read more in the Terms of Use.