I. Overall Approach
Long-term Trend: The bullish outlook remains unchanged.
Short-term Outlook: Gold prices are at historical highs, with technical indicators showing overbought conditions and a top divergence. Intraday volatility is expected to intensify. In terms of operation, the main idea is to go long at a low level after a pullback, and be cautious when chasing high prices. Aggressive traders may consider shorting at key resistance levels with a small position, maintaining strict stop-loss orders.
II. Key Technical Levels
Support Levels:
Primary Support: $3535-3540 (4-hour support and yesterday's low)
Strong Support: $3525-3535 (deeper pullback support)
Resistance Levels:
Initial Resistance: $3565-3570 (initial resistance during the Asian and European sessions)
Key Resistance: $3578 (near the previous high)
Upside Target: $3590-3600
III. Specific Trading Strategies
1. Long Strategy (Main Strategy)
Ideal Long Level: $3535-3540. Enter after stabilization with a stop-loss below $3525, targeting $3570-3578. After a breakout, hold further to $3590-3600.
Radical entry point: around $3550-3555 (hourly support). Try with a small position, set a stop-loss below $3540, and the same target as above. Conservative Strategy: Patiently wait for the price to fall back to the strong support area of $3525-3535 before going long. Set a stop-loss below $3510 and target $3560-3580.
2. Short Strategy (Secondary Strategy, for aggressive short-term trading only)
Entry Timing: If gold rebounds to the $3565-3570 area and shows clear resistance signals (such as a bearish engulfing candlestick pattern or a long upper shadow), or fails to break through the previous high of $3578, a small position can be used to try shorting.
Stop-loss: Above $3585.
Target: $3540-3550.
IV. Core Risks and Position Management
Data Risk: Today will see the release of the US ADP employment data ("small non-farm payroll") and initial jobless claims data. These data will be important foreshadowing tomorrow's non-farm payroll report and could trigger significant market volatility.
Trading Recommendation: Reduce positions or exit the market 1-2 hours before the data release. If you hold a position, you must set a loose stop loss to deal with sudden fluctuations.
Technical Risks: The RSI on the daily chart is in overbought territory, and the 4-hour chart is at risk of forming a top divergence, increasing the probability of a short-term technical correction. Avoid excessive buying after consecutive upward moves.
Position management: Intraday trading positions should not be too heavy, ensuring that single losses are controlled within 1%-2% of total funds.
Trade active
Latest Gold Trend Analysis and Trading Strategy:
I. Current Market Analysis and Key Strategy
Key Strategy: Prioritize buying on dips after a pullback before the trend breaks. At the same time, given that it is currently near the resistance level, it can be assisted by high-altitude short-term operations. The focus of trading should be on stabilization opportunities at key support levels.
II. Key Bull-Bear Dividing Points and Levels
Resistance: Strong resistance at 3570-3580 represents historical highs; a break above this level opens up new upside potential.
Immediate Resistance: 3558-3565 represents today's key resistance zone. If the price rebounds to this level and finds resistance, consider short-term short positions.
Support: Initial Support: 3510-3500 represents today's core support zone, the last line of defense for bullish traders. The first touch of stabilization is an important opportunity to buy on the dip.
Ultimate Support: 3490-3480 represents the lifeline of the bullish trend. A break below this level signals the start of a deep correction and a potential reversal of the short-term trend.
III. Specific Trading Strategies
1. Primary Strategy (Preferred): Go long after a pullback to the support zone
Trigger Condition: Gold price pulls back to the 3510-3500 area.
Entry Signal: A clear stabilizing candlestick pattern appears within the support zone (such as a pinbar dip, bullish engulfing candlestick pattern).
Stop-Loss: Place the stop-loss below 3495 (i.e., a clear break below 3500).
Targets: First target: 3530-3540, second target: 3550-3555.
2. Secondary Strategy (Secondary): Go short after a rebound to the resistance zone
Trigger Condition: Gold price rebounds to the 3558-3565 area.
Entry Signal: A clear stagnation or reversal signal appears within this area (such as a long upper shadow candlestick, bearish engulfing candlestick pattern).
Stop-Loss: Place the stop-loss above 3570 (i.e., a clear break above the previous high). Targets: First target: 3540-3530, second target: 3520-3510 (Note: This is a short-term short-term strategy, requiring quick entry and exit).
IV. Risk Warning and Special Reminders
Strict Stop-Loss: Regardless of the long or short strategy, strictly enforce stop-loss orders. The current market is at a historical high and experiencing significant volatility. Stop-loss orders are the only way to manage risk.
Position Management: Maintain a light position and reserve sufficient funds to capitalize on market trends following data releases.
Summary:
The dominant strategy for the day is "short first, then long," but "long" is the main theme, while "short" is a sideshow. During the Asia-Europe session, consider shorting in the 3558-3565 area, watching for a technical pullback. A pullback to the 3510-3500 area and stabilization presents a better opportunity to position for trend-following long positions.
Trade closed: target reached
Analysis and Strategy for the Latest Gold Trend on September 5:
I. Fundamental Analysis
The gold market is currently at a critical crossroads after reaching a historic high. Market sentiment is primarily driven by two key factors: the ebb and flow of safe-haven demand and the interplay between the US dollar and Federal Reserve policy expectations. Today's release of the US August non-farm payroll data (NFP) will be a key catalyst in determining the short-term direction.
US Dollar and Interest Rate Expectations: Everything Await Non-Farm Payrolls
Data Focus: This non-farm payrolls report is one of the most important economic indicators ahead of the Federal Reserve's September meeting. The market will use it to gauge the health of the US labor market and speculate on the Fed's monetary policy path.
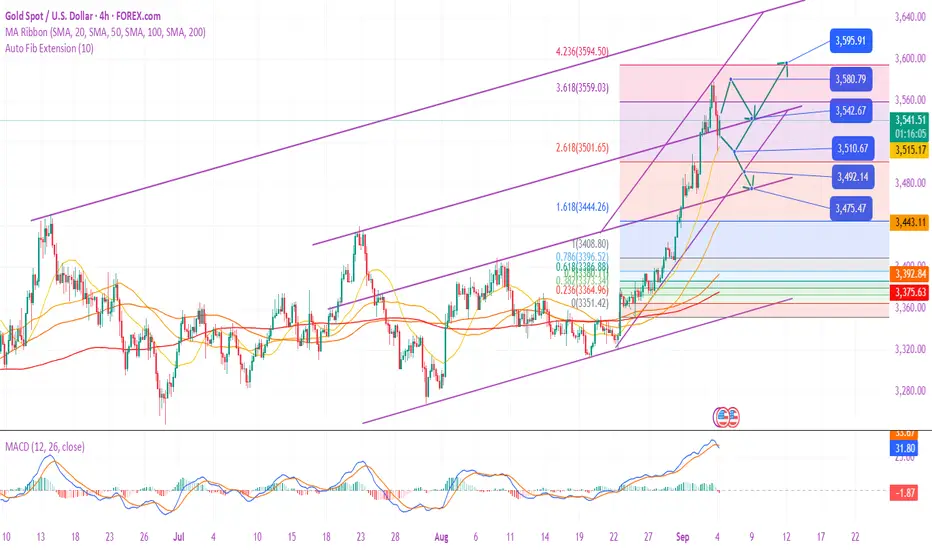
II. Technical Analysis
Trend Positioning: The long-term and primary trend is undoubtedly bullish. After breaking through the historical high, gold prices experienced a sharp one-day correction, but the overall upward structure was not destroyed.
Key Price Level Analysis:
Upside Resistance:
Short-term resistance: $3,568-3,578/oz. This represents the high point of yesterday's rebound and represents the path for gold prices to reach new all-time highs. Historical Highs/Strong Resistance: $3,600 and above (this week's all-time high).
Support Below:
Bull Lifeline: $3,530-3,520/oz. This represents the low of yesterday's pullback and is also the middle Bollinger Band on the 4-hour chart and key trend support. If this area is intact, the bull trend is intact.
Strength Dividing Point: $3,510/oz. The report clearly states that this level is a "critical strength and weakness point." A break below this level would signal a potential phased shift in the current uptrend, with gold potentially seeking deeper support (such as the 3,480-3,450 area).
III. Comprehensive Analysis and Trading Strategy
Core View: The trend is bullish, but short-term fluctuations are entirely dependent on the non-farm payroll data. The operation is mainly based on following the trend and buying low, but strict risk control is required to guard against unexpected fluctuations caused by data.
Strategy 1: Before the Non-Farm Payroll Data Release (Light Position or Wait and See)
It is recommended to place a light long position in the 3530-3525 area, with a stop-loss below 3510 (e.g., 3505), and target the 3560-3570 area.
If the gold price rebounds directly to the 3565-3575 area, a light short position can be tried with a small stop-loss (e.g., 3585), targeting 3540-3530 (taking advantage of a technical pullback before the data).
Strategy 2: Trend-following Trading After the Non-Farm Payroll Data Release (Main Strategy)
Scenario A: The data is bullish for gold (actual value < 73,000)
Operation: A pullback is a long opportunity. You can enter the market and go long when the gold price first falls back to the 3550-3540 area. Stop-loss: Below 3530.
Target: 3575 → 3590 → all-time high.
Scenario B: Data negative for gold (actual value > 75,000)
Action: Don't rush to short. Monitor gold's testing of key support levels. If the gold price falls rapidly and hits the strong support area of 3520-3510 for the first time, you can try to take long orders to test the bottom and rebound.
Stop-loss: Must be set below 3505.
Target: 3540-3550 on a rebound.
Note: If gold prices fall strongly below 3510 and fail to rebound, abandon long positions and switch to a rebound short strategy, targeting 3480-3450.
Scenario C: Data neutral (actual value between 73,000-75,000)
Operation: The market may react flatly, continuing technical volatility. We recommend buying low and selling high with
Risk Warning:
Non-farm payroll data can be volatile, so it's crucial to manage your positions and avoid excessive initial positions.
Market liquidity may plummet immediately after the data is released, leading to widening spreads and increased slippage risk. Limit orders are recommended over market orders.
Regardless of the data's direction, the gains and losses of the two key points of 3510 and 3575 will be the most important indicator for determining intraday strength.
❤️Free gold trading signals:t.me/+OJSbWQ6F4KM2Mzk1
💥Gold trading analyst | Technology + logic dual drive
💯Intraday/band strategy analysis | Risk control first, win in stability
💥Gold trading analyst | Technology + logic dual drive
💯Intraday/band strategy analysis | Risk control first, win in stability
Disclaimer
The information and publications are not meant to be, and do not constitute, financial, investment, trading, or other types of advice or recommendations supplied or endorsed by TradingView. Read more in the Terms of Use.