Trading the financial markets may seem mysterious at first glance. Prices move up and down within minutes, news headlines shake investor confidence, and charts look like random zig-zag patterns. But behind this chaos, there lies a structured language – the language of technical analysis (TA).
Technical analysis is the study of past price action and chart patterns to forecast future market behavior. Unlike fundamental analysis, which focuses on economic data, earnings, and macroeconomic events, technical analysis is about understanding the psychology of buyers and sellers as reflected in the price chart.
Why Technical Analysis Matters
Markets are driven by human behavior – fear, greed, uncertainty, and confidence. These emotions repeat themselves over time, creating recognizable patterns. Technical analysis doesn’t predict the future with 100% certainty, but it helps traders identify high-probability scenarios.
For example:
- If price consistently bounces from a certain level, traders call it support.
- If price struggles to move above a particular level, it becomes resistance.
- When these levels break, a new trend often begins.
By combining these concepts, traders can build strategies for intraday trading, swing trading, or even long-term investing.
The Core Principles of Technical Analysis
Before diving into charts, let’s outline the three golden principles that technical analysts believe in:
Market Discounts Everything
Every piece of information – economic data, news, investor sentiment – is already reflected in the price. The chart tells the whole story.
Price Moves in Trends
Markets are not random. They move in uptrends, downtrends, and sideways ranges. Identifying the trend is the first step in any analysis.
History Repeats Itself
Patterns like triangles, head and shoulders, flags, and channels have been repeating for decades because human behavior remains consistent.
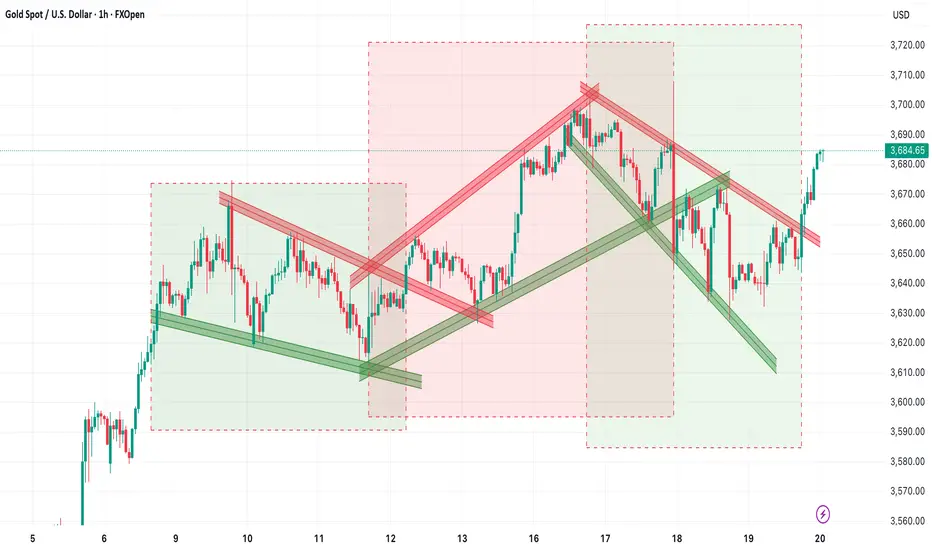
Decoding the Chart: Support, Resistance & Trendlines
Take a look at the Gold (XAU/USD) chart. At first, it may look like price is simply bouncing around. But once we draw trendlines and mark levels, a clear story unfolds.
1. Support and Resistance
- Support is where demand is strong enough to prevent the price from falling further. On the chart, the green trendlines show these bounce points.
- Resistance is where supply prevents the price from rising higher. The red trendlines highlight these areas.
Example:
If Gold bounces multiple times from the $3,630 zone, traders call it support. If it fails to cross $3,700 several times, that becomes resistance.
Traders often:
- Buy near support (with stop-loss below).
- Sell near resistance (with stop-loss above).
2. Trendlines
- Trendlines are diagonal lines drawn across swing highs or swing lows. They act like dynamic support and resistance.
- An uptrend line connects higher lows, showing bullish momentum.
- A downtrend line connects lower highs, signaling bearish pressure.
In the Gold chart:
- The green rising lines show bullish phases.
- The red falling lines show bearish corrections.
- When price breaks a trendline, it often signals a shift in trend.
3. Wedge & Patterns
- A Wedge is formed when price moves between two trendlines – one acting as support, the other as resistance.
- Ascending Wedge = Bullish structure.
- Descending Wedge = Bearish structure.
- Symmetrical Triangle = Consolidation.
- Sideways Channel = Consolidation.
In the chart, Gold moved within wedge before breaking out. This tells traders when to trade the range and when to prepare for breakout momentum.
Chart Patterns That Repeat in Every Market
Beyond support and resistance, technical analysis studies chart patterns. These are the footprints of market psychology.
1. Continuation Patterns
Indicate that the current trend will likely continue.
- Flags and Pennants
- Ascending Triangles
- Rectangles
2. Reversal Patterns
Suggest that the trend is about to change.
- Head and Shoulders
- Double Tops / Bottoms
- Descending Triangles
3. Breakouts
- When price escapes from a channel, triangle, or range, it signals a big move ahead.
In the Gold chart, you can clearly see multiple breakout points where price surged after leaving a Wedge.
Risk Management: The True Game Changer
Even the best technical setup can fail. That’s why risk management is the backbone of trading success.
Rules every trader should follow:
- Never risk more than 1-2% of account balance on a single trade.
- Always place a stop-loss.
- Follow a risk-to-reward ratio (RRR) of at least 1:2+.
- Example: Risking $100 to potentially make $200.
Avoid overtrading; patience pays.
Pros and Cons of Technical Analysis
Advantages
✔ Works across all markets – stocks, forex, crypto, commodities.
✔ Useful for intraday, swing, and long-term trading.
✔ Focuses on price action, the most direct reflection of market psychology.
Limitations
✘ False signals occur during low volume.
✘ Over-analysis can cause “paralysis by analysis.”
✘ Works best when combined with fundamentals and risk management.
Final Thoughts: Technical Analysis as a Trader’s Compass
- Technical analysis is not about predicting the market with magic. It’s about understanding probabilities, spotting patterns, and managing risks.
- When you master support, resistance, trendlines, and candlestick psychology, charts stop looking like random chaos – and start telling you stories.
Remember:
- Price is the ultimate truth.
- Risk management protects your capital.
- Consistency builds profits over time.
Whether you trade Gold, stocks, or crypto, the principles remain the same. The more you practice, the sharper your eye becomes in spotting opportunities.
So the next time you look at a chart, don’t just see candles. See the psychology of thousands of traders battling it out – and use technical analysis as your compass to navigate the markets.
Thread>>Live Examples
Technical analysis is the study of past price action and chart patterns to forecast future market behavior. Unlike fundamental analysis, which focuses on economic data, earnings, and macroeconomic events, technical analysis is about understanding the psychology of buyers and sellers as reflected in the price chart.
Why Technical Analysis Matters
Markets are driven by human behavior – fear, greed, uncertainty, and confidence. These emotions repeat themselves over time, creating recognizable patterns. Technical analysis doesn’t predict the future with 100% certainty, but it helps traders identify high-probability scenarios.
For example:
- If price consistently bounces from a certain level, traders call it support.
- If price struggles to move above a particular level, it becomes resistance.
- When these levels break, a new trend often begins.
By combining these concepts, traders can build strategies for intraday trading, swing trading, or even long-term investing.
The Core Principles of Technical Analysis
Before diving into charts, let’s outline the three golden principles that technical analysts believe in:
Market Discounts Everything
Every piece of information – economic data, news, investor sentiment – is already reflected in the price. The chart tells the whole story.
Price Moves in Trends
Markets are not random. They move in uptrends, downtrends, and sideways ranges. Identifying the trend is the first step in any analysis.
History Repeats Itself
Patterns like triangles, head and shoulders, flags, and channels have been repeating for decades because human behavior remains consistent.
Decoding the Chart: Support, Resistance & Trendlines
Take a look at the Gold (XAU/USD) chart. At first, it may look like price is simply bouncing around. But once we draw trendlines and mark levels, a clear story unfolds.
1. Support and Resistance
- Support is where demand is strong enough to prevent the price from falling further. On the chart, the green trendlines show these bounce points.
- Resistance is where supply prevents the price from rising higher. The red trendlines highlight these areas.
Example:
If Gold bounces multiple times from the $3,630 zone, traders call it support. If it fails to cross $3,700 several times, that becomes resistance.
Traders often:
- Buy near support (with stop-loss below).
- Sell near resistance (with stop-loss above).
2. Trendlines
- Trendlines are diagonal lines drawn across swing highs or swing lows. They act like dynamic support and resistance.
- An uptrend line connects higher lows, showing bullish momentum.
- A downtrend line connects lower highs, signaling bearish pressure.
In the Gold chart:
- The green rising lines show bullish phases.
- The red falling lines show bearish corrections.
- When price breaks a trendline, it often signals a shift in trend.
3. Wedge & Patterns
- A Wedge is formed when price moves between two trendlines – one acting as support, the other as resistance.
- Ascending Wedge = Bullish structure.
- Descending Wedge = Bearish structure.
- Symmetrical Triangle = Consolidation.
- Sideways Channel = Consolidation.
In the chart, Gold moved within wedge before breaking out. This tells traders when to trade the range and when to prepare for breakout momentum.
Chart Patterns That Repeat in Every Market
Beyond support and resistance, technical analysis studies chart patterns. These are the footprints of market psychology.
1. Continuation Patterns
Indicate that the current trend will likely continue.
- Flags and Pennants
- Ascending Triangles
- Rectangles
2. Reversal Patterns
Suggest that the trend is about to change.
- Head and Shoulders
- Double Tops / Bottoms
- Descending Triangles
3. Breakouts
- When price escapes from a channel, triangle, or range, it signals a big move ahead.
In the Gold chart, you can clearly see multiple breakout points where price surged after leaving a Wedge.
Risk Management: The True Game Changer
Even the best technical setup can fail. That’s why risk management is the backbone of trading success.
Rules every trader should follow:
- Never risk more than 1-2% of account balance on a single trade.
- Always place a stop-loss.
- Follow a risk-to-reward ratio (RRR) of at least 1:2+.
- Example: Risking $100 to potentially make $200.
Avoid overtrading; patience pays.
Pros and Cons of Technical Analysis
Advantages
✔ Works across all markets – stocks, forex, crypto, commodities.
✔ Useful for intraday, swing, and long-term trading.
✔ Focuses on price action, the most direct reflection of market psychology.
Limitations
✘ False signals occur during low volume.
✘ Over-analysis can cause “paralysis by analysis.”
✘ Works best when combined with fundamentals and risk management.
Final Thoughts: Technical Analysis as a Trader’s Compass
- Technical analysis is not about predicting the market with magic. It’s about understanding probabilities, spotting patterns, and managing risks.
- When you master support, resistance, trendlines, and candlestick psychology, charts stop looking like random chaos – and start telling you stories.
Remember:
- Price is the ultimate truth.
- Risk management protects your capital.
- Consistency builds profits over time.
Whether you trade Gold, stocks, or crypto, the principles remain the same. The more you practice, the sharper your eye becomes in spotting opportunities.
So the next time you look at a chart, don’t just see candles. See the psychology of thousands of traders battling it out – and use technical analysis as your compass to navigate the markets.
Thread>>Live Examples
📈 Trade Smarter with TradZoo!
📣 Telegram: t.me/tradzooIndex
📣 Forex Telegram: t.me/tradzoofx
📲 Mobile App: tradzoo.com/download
📲 Forex App:tradzoo.com/forex/download
🔗 Website: bit.ly/tradzoopage
📣 Telegram: t.me/tradzooIndex
📣 Forex Telegram: t.me/tradzoofx
📲 Mobile App: tradzoo.com/download
📲 Forex App:tradzoo.com/forex/download
🔗 Website: bit.ly/tradzoopage
Disclaimer
The information and publications are not meant to be, and do not constitute, financial, investment, trading, or other types of advice or recommendations supplied or endorsed by TradingView. Read more in the Terms of Use.