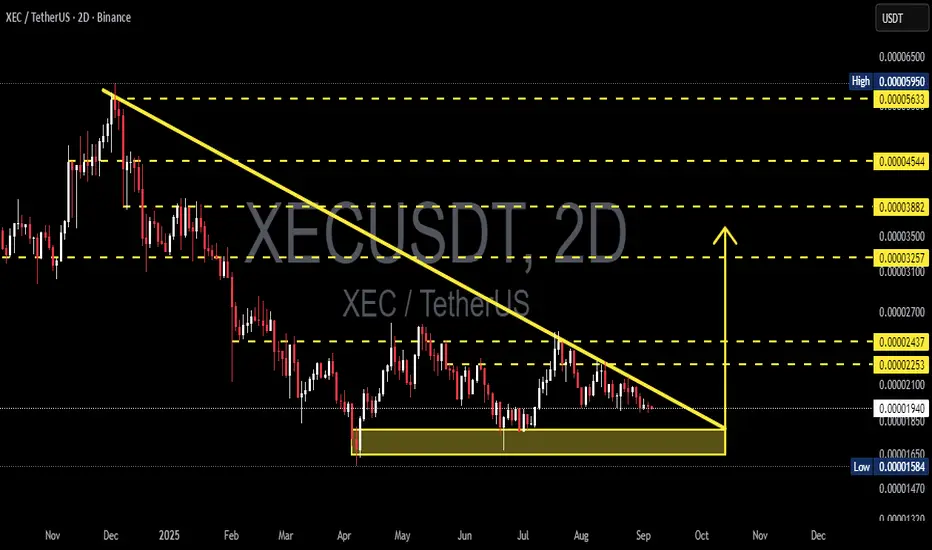
XEC/USDT is currently moving in a critical consolidation phase after a prolonged downtrend since early 2025. On the 2D timeframe, the chart clearly forms a descending triangle, with a consistent downtrend line pressing the price lower, while buyers are still defending a strong support zone at the bottom.
---
🔎 Technical Overview
Main Pattern: Descending Triangle (statistically bearish continuation, but direction requires confirmation).
Key Support Zone (yellow box): 0.00001584 – 0.00001850 → tested multiple times as buyers’ defense.
Downtrend Line: Pressuring price since early 2025, showing persistent selling pressure.
Current Price: around 0.00001940.
First Resistance Zone: 0.00002253 – 0.00002437 (critical breakout area).
Higher Resistances: 0.00003257, 0.00003882, 0.00004544, up to 0.00005633.
---
🟢 Bullish Scenario
If the price breaks above the downtrend line and closes above 0.00002253–0.00002437 with strong volume, the descending triangle may fail as a bearish setup and instead flip into a bullish reversal signal.
Measured Move Target: ~0.00003106.
Next Resistance Targets: 0.00003257, 0.00003882, and 0.00004544.
Upside Potential: +60% to +120% from current levels if momentum follows through.
Retest of the broken trendline as new support would add extra confirmation.
---
🔴 Bearish Scenario
If price fails to hold and closes below 0.00001584 on the 2D chart with strong volume, the descending triangle confirms its bearish continuation pattern.
Downside Target (measured move): ~0.00000730.
Downside Risk: More than -60% from current price levels.
After breakdown, a small pullback to retest the old support as resistance is highly possible before further decline.
---
📌 Key Notes
Volume is crucial: A breakout/breakdown without significant volume risks becoming a false move.
Confirm via 2D close: Intraday wicks can be misleading; use 2D candle close for validation.
Risk management:
For bullish setups → stop-loss below support zone.
For bearish setups → stop-loss above retest zone.
Market context: Altcoins like XEC are highly influenced by BTC’s dominance and overall crypto liquidity — always check the bigger picture.
---
📝 Conclusion
XEC is now at a make-or-break level. The descending triangle could resolve into two extremes: a bullish reversal breakout toward 0.000031–0.000038, or a bearish breakdown toward ~0.000007.
As long as price trades inside the triangle, the best approach is to wait for breakout or breakdown confirmation before taking major positions. Aggressive traders may prepare for breakout + retest entries, while long-term investors might see this support zone as an accumulation range — but with strict risk management.
---
#XEC #XECUSDT #CryptoAnalysis #TradingView #Altcoin #ChartPattern #DescendingTriangle #BreakoutTrading #CryptoStrategy
---
🔎 Technical Overview
Main Pattern: Descending Triangle (statistically bearish continuation, but direction requires confirmation).
Key Support Zone (yellow box): 0.00001584 – 0.00001850 → tested multiple times as buyers’ defense.
Downtrend Line: Pressuring price since early 2025, showing persistent selling pressure.
Current Price: around 0.00001940.
First Resistance Zone: 0.00002253 – 0.00002437 (critical breakout area).
Higher Resistances: 0.00003257, 0.00003882, 0.00004544, up to 0.00005633.
---
🟢 Bullish Scenario
If the price breaks above the downtrend line and closes above 0.00002253–0.00002437 with strong volume, the descending triangle may fail as a bearish setup and instead flip into a bullish reversal signal.
Measured Move Target: ~0.00003106.
Next Resistance Targets: 0.00003257, 0.00003882, and 0.00004544.
Upside Potential: +60% to +120% from current levels if momentum follows through.
Retest of the broken trendline as new support would add extra confirmation.
---
🔴 Bearish Scenario
If price fails to hold and closes below 0.00001584 on the 2D chart with strong volume, the descending triangle confirms its bearish continuation pattern.
Downside Target (measured move): ~0.00000730.
Downside Risk: More than -60% from current price levels.
After breakdown, a small pullback to retest the old support as resistance is highly possible before further decline.
---
📌 Key Notes
Volume is crucial: A breakout/breakdown without significant volume risks becoming a false move.
Confirm via 2D close: Intraday wicks can be misleading; use 2D candle close for validation.
Risk management:
For bullish setups → stop-loss below support zone.
For bearish setups → stop-loss above retest zone.
Market context: Altcoins like XEC are highly influenced by BTC’s dominance and overall crypto liquidity — always check the bigger picture.
---
📝 Conclusion
XEC is now at a make-or-break level. The descending triangle could resolve into two extremes: a bullish reversal breakout toward 0.000031–0.000038, or a bearish breakdown toward ~0.000007.
As long as price trades inside the triangle, the best approach is to wait for breakout or breakdown confirmation before taking major positions. Aggressive traders may prepare for breakout + retest entries, while long-term investors might see this support zone as an accumulation range — but with strict risk management.
---
#XEC #XECUSDT #CryptoAnalysis #TradingView #Altcoin #ChartPattern #DescendingTriangle #BreakoutTrading #CryptoStrategy
✅ Get Free Signals! Join Our Telegram Channel Here: t.me/TheCryptoNuclear
✅ Twitter: twitter.com/crypto_nuclear
✅ Join Bybit : partner.bybit.com/b/nuclearvip
✅ Benefits : Lifetime Trading Fee Discount -50%
✅ Twitter: twitter.com/crypto_nuclear
✅ Join Bybit : partner.bybit.com/b/nuclearvip
✅ Benefits : Lifetime Trading Fee Discount -50%
Disclaimer
The information and publications are not meant to be, and do not constitute, financial, investment, trading, or other types of advice or recommendations supplied or endorsed by TradingView. Read more in the Terms of Use.