I have loved  XMR charts so much recently, and now they’re getting even more BULLISH despite the latest crypto sell-offs.
First of all, my favourite HIDDEN RSI divergences — I talk about them a lot for sure, but they tend to add to high-probability set-ups, by a lot, in my experience.
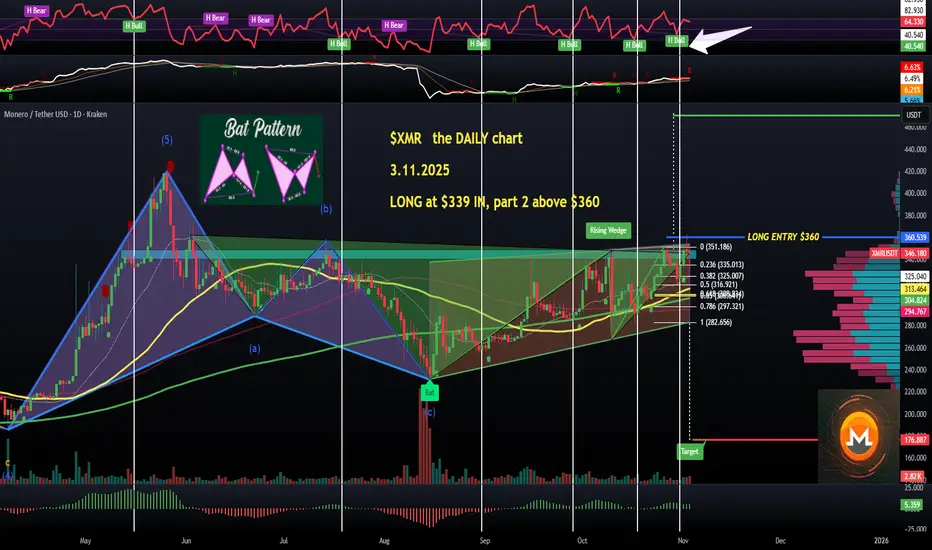
Have a look at the DAILY — out of the previous five cases, four led to immediate pumps, and #Monero has one of those active right now.
I had three ways to enter a long position in the quoted post published on Oct 28, one of them being buy-the-dip orders below $315 — that missed by literally $2 as the price dipped to fib 0.5 ($317), a perfect bounce that could signal a new ELLIOT WAVE structure (waves 1 + 2 done?).
Another strategy was to enter this old-school #PrivacyCoin after a retracement and rebound, so I did at $339, and that was a half-size trade. Another half will trigger as per my main strategy, which is a BREAKOUT ABOVE $355, entry around $360.
Horizontal lines on the chart show previous behaviour of price post-HIDDEN BULL RSI div’s.
They precede my best buy signals — and there have been plenty of these as well, also a rarity.
👽💙
First of all, my favourite HIDDEN RSI divergences — I talk about them a lot for sure, but they tend to add to high-probability set-ups, by a lot, in my experience.
Have a look at the DAILY — out of the previous five cases, four led to immediate pumps, and #Monero has one of those active right now.
I had three ways to enter a long position in the quoted post published on Oct 28, one of them being buy-the-dip orders below $315 — that missed by literally $2 as the price dipped to fib 0.5 ($317), a perfect bounce that could signal a new ELLIOT WAVE structure (waves 1 + 2 done?).
Another strategy was to enter this old-school #PrivacyCoin after a retracement and rebound, so I did at $339, and that was a half-size trade. Another half will trigger as per my main strategy, which is a BREAKOUT ABOVE $355, entry around $360.
Horizontal lines on the chart show previous behaviour of price post-HIDDEN BULL RSI div’s.
They precede my best buy signals — and there have been plenty of these as well, also a rarity.
👽💙
Disclaimer
The information and publications are not meant to be, and do not constitute, financial, investment, trading, or other types of advice or recommendations supplied or endorsed by TradingView. Read more in the Terms of Use.
Disclaimer
The information and publications are not meant to be, and do not constitute, financial, investment, trading, or other types of advice or recommendations supplied or endorsed by TradingView. Read more in the Terms of Use.