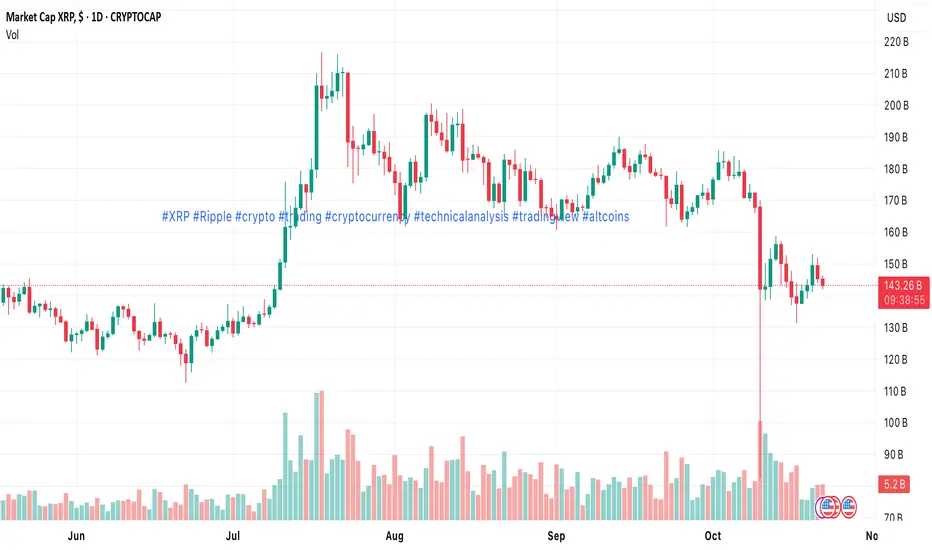
XRP/USD continues to move within a descending channel, confirming a sustained bearish structure. Earlier in the month, the pair attempted to break out above 3.1250 (Murray [8/8]), but the move failed, triggering a renewed selloff as U.S.–China trade tensions escalated and risk appetite faded.
Currently, the pair is hovering near 2.3438 (Murray [4/8]), a critical support level. A clear break below this zone could accelerate the decline toward 1.9531 (Murray [2/8]) and 1.5625 (Murray [0/8]). On the flip side, a recovery above 2.6220–2.7344 (mid-Bollinger Band, Murray [6/8]) would invalidate the bearish structure and open the door to 3.1250 (Murray [8/8]) and 3.5156 (Murray [+2/8]) — though this remains a less likely scenario for now.
⸻
Technical Analysis
• Trend: Still bearish; lower highs confirm downside structure.
• Bollinger Bands: Expanding downward — volatility rising with pressure on the downside.
• MACD: Flat in the negative zone — momentum favors sellers.
• Stochastic: Near overbought — potential for a downside reversal.
On the weekly timeframe, XRP is holding below the midline of the Bollinger Bands, keeping the broader downtrend intact.
⸻
Trading Plan
📉 Sell Setup
• Entry: 2.3435
• Targets: 1.9531 → 1.5625
• Stop-Loss: 2.6500
• Time Horizon: 5–7 days
📈 Buy Setup (Breakout Confirmation)
• Entry: 2.7345
• Targets: 3.1250 → 3.5156
• Stop-Loss: 2.4500
⸻
Key Levels
Support: 2.3438 · 1.9531 · 1.5625
Resistance: 2.7344 · 3.1250 · 3.5156
⸻
💬 XRP remains under bearish pressure. A daily close below 2.34 could confirm another leg down toward 1.95, while only a breakout above 2.73 would shift momentum in favor of the bulls.
Disclaimer
The information and publications are not meant to be, and do not constitute, financial, investment, trading, or other types of advice or recommendations supplied or endorsed by TradingView. Read more in the Terms of Use.
Disclaimer
The information and publications are not meant to be, and do not constitute, financial, investment, trading, or other types of advice or recommendations supplied or endorsed by TradingView. Read more in the Terms of Use.
