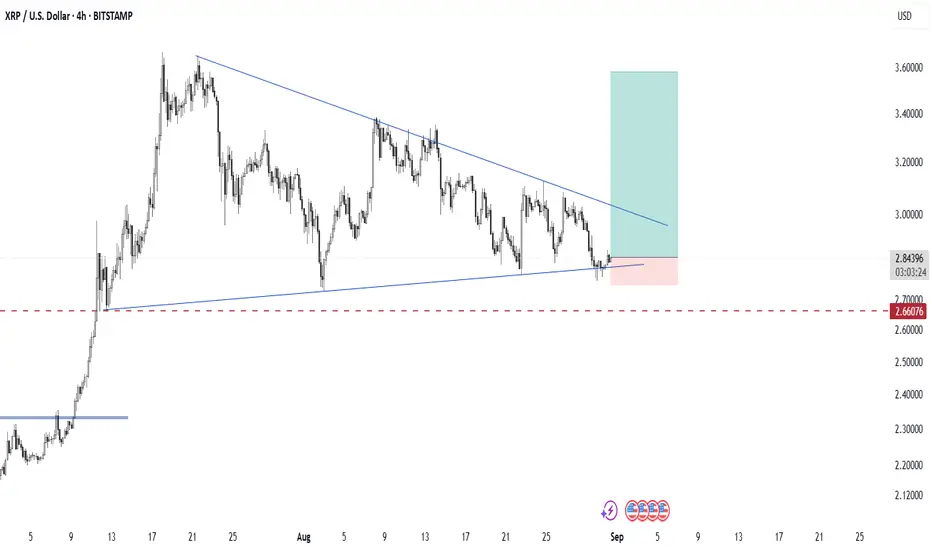
XRP is currently consolidating within a symmetrical triangle pattern, with price action forming lower highs and higher lows. This indicates a period of compression where volatility is decreasing, and a potential breakout could be approaching.
At the moment, the price is testing the lower boundary of the triangle, showing signs of support. As long as XRP holds above the $2.66 support level (highlighted by the dashed red line), the bullish scenario remains valid.
Pattern: Symmetrical Triangle (continuation/neutral pattern)
Entry Zone: Current support trendline near $2.18–$2.20
Stop Loss: Below $2.66 support zone
Target Zone: $3.40 – $3.60 (upper projection of the triangle)
📌 A confirmed breakout above the descending trendline could trigger strong bullish momentum, while a breakdown below $2.66 would invalidate this setup and open the door for deeper correction.
Disclaimer
The information and publications are not meant to be, and do not constitute, financial, investment, trading, or other types of advice or recommendations supplied or endorsed by TradingView. Read more in the Terms of Use.
Disclaimer
The information and publications are not meant to be, and do not constitute, financial, investment, trading, or other types of advice or recommendations supplied or endorsed by TradingView. Read more in the Terms of Use.