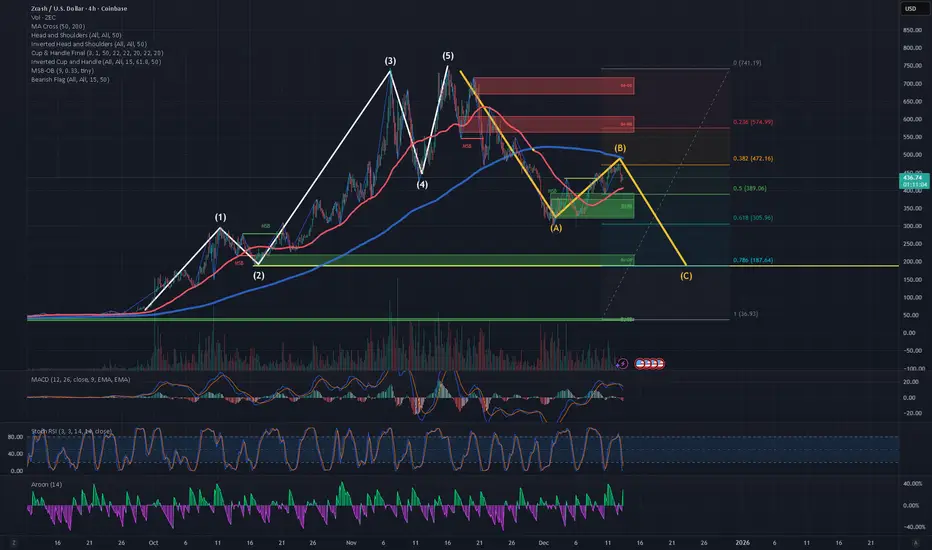
On the four-hour time frame, the Aroon indicator is positive and showing green because of the recent strong upward price movement. The Aroon is reflecting the impulsive advance that occurred between December 1st and December 12th, which I am interpreting as Wave B.
Prior to this, there was a clear five-wave impulsive move upward, and price now appears to be in a three-wave A–B–C corrective structure. I believe that Wave B of this corrective move is nearing completion, and that price is now beginning the decline associated with Wave C.
I believe the likelihood of further downard movement to fullfil wave C of the current three wave A-B-C structure is high, like 60 to70% based on the following reasons:
In theory, the chart says "down to $200", but the reality is that buyers have been very active, both humans and algorithims. It seems like any price below $400 is good buy for ZEC.
In my view buyers will defend the $330 to 350 price point.
This analysis represents a probabilistic scenario rather than a guarantee, and invalidation would occur if price reclaims key resistance with expanding momentum.
This post is Not Financial Advice.
Prior to this, there was a clear five-wave impulsive move upward, and price now appears to be in a three-wave A–B–C corrective structure. I believe that Wave B of this corrective move is nearing completion, and that price is now beginning the decline associated with Wave C.
I believe the likelihood of further downard movement to fullfil wave C of the current three wave A-B-C structure is high, like 60 to70% based on the following reasons:
- Four-hour and twelve-hour structure is corrective / weakening
- Momentum (MACD) has rolled over
- RSI is not resetting bullishly
- Aroon suggests trend strength is fading, not expanding
- Elliott interpretation of Wave B nearing completion is plausible
In theory, the chart says "down to $200", but the reality is that buyers have been very active, both humans and algorithims. It seems like any price below $400 is good buy for ZEC.
- $200 represents a tail-risk scenario
- $330 - 350 represents a behaviorally supported zone
In my view buyers will defend the $330 to 350 price point.
This analysis represents a probabilistic scenario rather than a guarantee, and invalidation would occur if price reclaims key resistance with expanding momentum.
This post is Not Financial Advice.
Disclaimer
The information and publications are not meant to be, and do not constitute, financial, investment, trading, or other types of advice or recommendations supplied or endorsed by TradingView. Read more in the Terms of Use.
Disclaimer
The information and publications are not meant to be, and do not constitute, financial, investment, trading, or other types of advice or recommendations supplied or endorsed by TradingView. Read more in the Terms of Use.