The ZKUSDT (Daily) pair has reached a critical juncture that will decide its next major move. Since early 2025, price action has been trapped below a descending trendline, acting as a dominant wall of selling pressure. Every breakout attempt has been rejected, reaffirming bearish control.
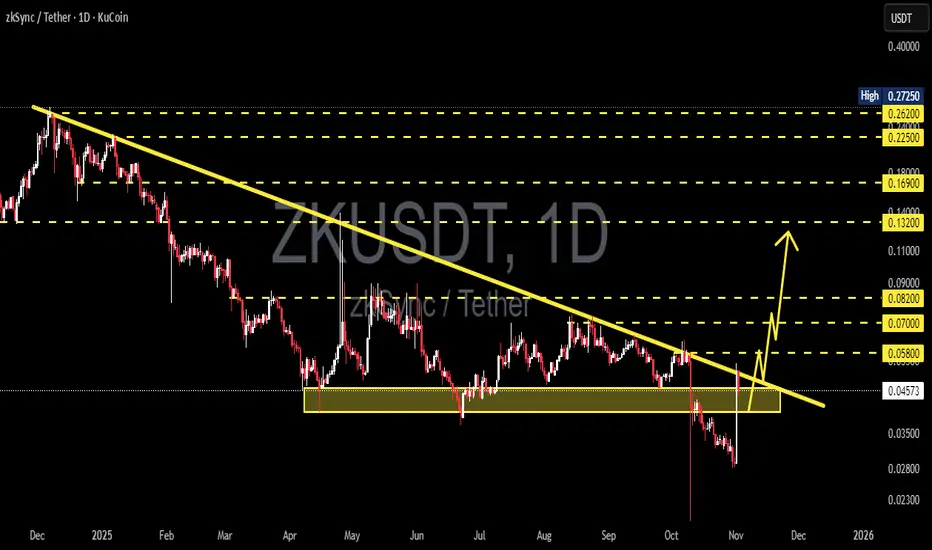
Now, the price is sitting right at the crossroads — between the descending trendline above and a key accumulation/support zone at 0.0465–0.040 (yellow block) below.
This zone isn’t just another range — it’s the battleground that will determine whether ZKSync is preparing for a major reversal or about to continue its downtrend into new lows.
---
Pattern & Structure:
Formation of a Descending Triangle with a flat horizontal base (0.0465–0.040) and a falling trendline resistance.
The structure shows persistent selling pressure, but every dip into the lower zone attracts strong buying reactions — a clear tug-of-war between bulls and bears.
A recent liquidity grab (false breakout wick) signals stop-hunting activity, often a precursor to a major move.
The market is coiling tightly — volatility compression suggests a large expansion phase is near.
---
Bullish Scenario: “Reversal Confirmed”
If ZK successfully closes and holds above the descending trendline with strong momentum and volume, it could mark the start of a new medium-term uptrend.
Key confirmation:
Daily close above 0.048–0.050
Successful retest of the trendline as new support
Upside targets:
1. 0.058 — first resistance and structural pivot
2. 0.070 — confirmation of trend reversal
3. 0.082 → 0.132 — extended bullish targets if momentum continues
Rationale:
Breaking a descending triangle to the upside often triggers a short squeeze as traders exit bearish positions, accelerating price movement and initiating a shift in market structure.
---
Bearish Scenario: “Final Breakdown”
If ZK fails to hold its ground and closes daily below 0.040, the descending triangle pattern would confirm as a bearish continuation, signaling further downside.
Key confirmation:
Strong daily close below 0.040
Failed retest from below (support turned resistance)
Downside targets:
1. 0.028 — previous local low
2. 0.023 — potential capitulation zone
Rationale:
Losing this base indicates buyers have fully lost control. Historically, such breakdowns lead to sharp selloffs as short-term holders exit rapidly, increasing momentum on the downside.
---
Conclusion:
> ZKSync is sitting at a make-or-break level — a zone that will define the next directional wave.
Bullish case: breakout above trendline → targets 0.058–0.070.
Bearish case: breakdown below 0.040 → targets 0.028–0.023.
Expect a major volatility expansion once this compression phase resolves.
---
Trading Strategy & Risk Notes:
Wait for daily candle confirmation, not just wicks — avoid getting trapped in fakeouts.
Conservative entry: after breakout + retest.
Aggressive entry: near support with clear rejection confirmation.
Stop-loss: below 0.040 (for longs) or above 0.0465 (for shorts).
Maintain a risk/reward ratio of at least 1:2 and scale out profits at each target level.
---
Key Technical Levels:
Support zone: 0.0465 – 0.040
Trendline resistance: ~0.048–0.050
Upside levels: 0.058 → 0.070 → 0.082 → 0.132
Downside targets: 0.028 → 0.023
#ZKUSDT #ZKSync #CryptoAnalysis #DescendingTriangle #BreakoutTrading #SupportResistance #CryptoBreakout #ChartAnalysis #PriceAction #CryptoTrader #ReversalZone #BearishOrBullish
✅ Get Free Signals! Join Our Telegram Channel Here: t.me/TheCryptoNuclear
✅ Twitter: twitter.com/crypto_nuclear
✅ Join Bybit : partner.bybit.com/b/nuclearvip
✅ Benefits : Lifetime Trading Fee Discount -50%
✅ Twitter: twitter.com/crypto_nuclear
✅ Join Bybit : partner.bybit.com/b/nuclearvip
✅ Benefits : Lifetime Trading Fee Discount -50%
Disclaimer
The information and publications are not meant to be, and do not constitute, financial, investment, trading, or other types of advice or recommendations supplied or endorsed by TradingView. Read more in the Terms of Use.