NewtekOne | NEWT | Long at $10.92NewtekOne NASDAQ:NEWT is a financial holding company providing business and financial solutions to small- and medium-sized businesses across the U.S. Services include Newtek Bank, business lending, SBA loans, electronic payment processing, payroll and benefits, insurance, and technology solutions. While the stock has taken a major hit recently, insiders have scooped up over $1 million in shares with an average price of $11.70. Currently trading at a P/E of 5.6x, forward P/E of 6.6x, and near book value, the stock may be poised for a move up soon with the anticipation of interest rates dropping. Revenue is up 24.93% from $271.15M (2023) to $338.73M (2024) and earnings are forecast to grow 11.63% per year, but the company does have a high debt-to-equity ratio (over 5x).
Tariffs could indirectly impact NASDAQ:NEWT by increasing costs for its small- and medium-sized business clients, particularly in industries reliant on imports (e.g., manufacturing, retail). Higher costs may reduce client profitability, increasing loan default risks or reducing demand for Newtek’s lending and payment processing services. But an interest rate reversal may greatly limit the impact (longer-term).
So, at $10.92, NASDAQ:NEWT is in a personal buy zone.
Targets into 2027:
$12.00 (+9.9%)
$14.00 (+28.2%)
Banking

Goldman Sachs 2026: The New Architect of Capital?Goldman Sachs (GS) is no longer just an investment bank; it is evolving into a geopolitical and technological hedge fund. As the firm approaches its Q4 2025 earnings report this Thursday, January 15, the market anticipates more than just beat-and-raise metrics. Investors are pricing in a fundamental transformation. The stock has outperformed the broader financial sector, driven by a decisive pivot toward asset management stability and aggressive AI integration.
Geopolitics & Geostrategy: The Commodity Supercycle
Goldman Sachs has positioned itself as the primary architect of the "New Trade Order."
* Resource Nationalism: The bank’s research arm correctly predicted the 2025 commodity squeeze. They are now doubling down on "critical mineral sovereignty," advising governments on securing copper and lithium supply chains essential for the AI arms race.
* Trade Flows: GS is leveraging its global footprint to navigate the fragmented US-China relationship. By facilitating "friend-shoring" deals between the US, Japan, and the UK, the bank has captured high-margin advisory fees from complex cross-border restructuring.
Business Models & Innovation
The firm is successfully reducing its reliance on volatile trading revenues.
* Asset Management Pivot: The shift to stable, fee-based revenue is working. Asset & Wealth Management now acts as the firm's ballast, smoothing out the jagged edges of investment banking cycles.
* Private Credit: GS has aggressively expanded into private credit, filling the void left by regional banks. This move captures higher yields and cements deep relationships with private equity sponsors who value speed over regulation-heavy traditional lending.
Technology & High-Tech: The AI Dividend
Goldman Sachs is arguably the most aggressive adopter of "Agentic AI" on Wall Street.
* Internal Efficiency: The deployment of proprietary Large Language Models (LLMs) for coding and compliance has reportedly improved developer productivity by 40%. This is not just cost-cutting; it is operational leverage.
* Fintech Patents: Patent analysis reveals a surge in GS filings under classification G06Q (Data Processing/Financial). The focus is clear: automated algorithmic trading and blockchain-based settlement layers that reduce counterparty risk.
Management & Leadership: The 2025 Reshuffle
The leadership restructuring initiated in early 2025 is bearing fruit.
* Culture Shift: The "Managing Director Class of 2025" is notably younger and more tech-centric. This demographic shift is dismantling the rigid silos of the past, fostering a "One Goldman" culture that cross-sells effectively between trading, banking, and wealth divisions.
* Executive Compensation: Renewed focus on executive security and cyber-protection benefits reflects the heightened threat landscape facing high-profile financiers.
Macroeconomics & Economic Outlook
The macroeconomic backdrop for 2026 favors the Goldman playbook.
* Dealmaking Revival: With interest rates stabilizing, the M&A freeze has thawed. Corporations are flush with cash and looking to deploy it. Goldman, having led the 2025 league tables with $1.48 trillion in advised deals, is the prime beneficiary of this pent-up demand.
* The "K-Shaped" Recovery: The bank’s strategy aligns perfectly with the current economic reality. High-net-worth clients continue to prosper, driving wealth management inflows, while corporate consolidation drives banking fees.
Cyber & Security: The Fortress Balance Sheet
Trust is the ultimate currency.
* Cyber Defense: The bank’s "Zero Trust" architecture is now a selling point for institutional clients. In an era of state-sponsored cyber warfare, GS positions its custodial services as a digital fortress, superior to arguably less secure decentralized competitors.
Conclusion
Goldman Sachs enters 2026 not as a passive participant in the markets, but as an active shaper of them. By fusing geopolitical foresight with technological aggression, the firm has built a moat that is difficult to cross. Thursday’s earnings will likely confirm what the stock chart already suggests: the "Vampire Squid" is back, and it is smarter than ever.

PNC Financial Services 1Y Chart Review - Limited Room for GrowthToday you can review the technical analysis idea on a 1Y linear scale chart for PNC Financial Services (PNC).
It seems there is some action going on here with PNC with potential for some additional growth. RSI is over 70 and potential for retracement coming up soon.
If you enjoy my ideas, feel free to like it and drop in a comment. I love reading your comments below.
Disclosure: This is just my opinion and not any type of financial advice. I enjoy charting and discussing technical analysis. Don't trade based on my advice. Do your own research! #millionaireeconomics #PNC

TD Toronto Dominion 1Y Chart Review - Price is highToday you can review the technical analysis idea on a 1Y linear scale chart for Toronto Dominion (TD).
It seems there is some action going on here with TD reviewing the Fibonacci, Trends, KC, and RSI. The price is quite high, keep an eye on it.
If you enjoy my ideas, feel free to like it and drop in a comment. I love reading your comments below.
Disclosure: This is just my opinion and not any type of financial advice. I enjoy charting and discussing technical analysis. Don't trade based on my advice. Do your own research! #millionaireeconomics #TD

WFC Wells Fargo & Company 1Y Chart Review - What's NextToday you can review the technical analysis idea on a 1Y linear scale chart for Wells Fargo & Company (WFC).
It seems there is some action going on here with WFC reviewing the Fibonacci, Trends, and RSI. This may be a concern.
If you enjoy my ideas, feel free to like it and drop in a comment. I love reading your comments below.
Disclosure: This is just my opinion and not any type of financial advice. I enjoy charting and discussing technical analysis. Don't trade based on my advice. Do your own research! #millionaireeconomics #WFC

BAC Bank of America 1Y Chart Review - RSI/KC concernToday you can review the technical analysis idea on a 1Y linear scale chart for Bank of America (BAC).
It seems there is some action going on here with BAC reviewing the RSI and the Keltner Channel. This may be a concern.
If you enjoy my ideas, feel free to like it and drop in a comment. I love reading your comments below.
Disclosure: This is just my opinion and not any type of financial advice. I enjoy charting and discussing technical analysis. Don't trade based on my advice. Do your own research! #millionaireeconomics #BAC

Fiserv | FI | Long at $69.91For the first time since its IPO in 1986, a "major stock" crash has happened to Fiserv NYSE:FI . Previously, the stock "crashed" and followed the trajectory of ups and downs of the S&P 500, but this one is different. And, perhaps, a major opportunity for savy investors.
I won't say much about the financials since after today's earnings call the stock plummeted and earnings/revenue projections will get revised serval times, but this was a high-growth opportunity in the past. What I see today is a huge overreaction to a company going through a growth transition, but by all means, not dead... yet www.tradingview.com
I think we'll see leadership shakeups, layoffs, and system adaptions into 2026. This drop, and where it landed near my major crash simple moving average, hints this price cut was planned (at least algorithmically) and I won't be surprised if the near-term bottom is in or almost in in the $60s. Thus, at $69.91, NYSE:FI is in a personal buy-zone.
Conservative Targets into 2028:
$85.00 (+21.6%)
$100.00 (+43.0%)

2008 Crisis and How the Banking System Has Changed Since:
⚠️These headlines serve as a reminder that despite the Basel I, II, and III global banking regulations, we have not been spared from systemic risks originating within the financial system itself
🏦After the 2008 crisis, banks became heavily overregulated. As a result, many of their most lucrative investment and financing activities shifted into affiliated offshore hedge funds — entities that remain very much part of the same global financial machinery. They are simply no longer called “banks,” and therefore escape almost all regulation.
💵These hedge funds lend, repackage loans, buy and sell exotic financial instruments, re-hypothecate, and re-collateralize. They use questionable collateral to issue risky loans , which are then resold, repackaged, and used again as collateral again.
💰 Exotic derivatives, curreny swaps, REPO operations, outright fraud,risky options market-making, — you name it — all thrive offshore , far from regulatory oversight yet just a click away for clients. And make no mistake: these so-called “non-banks” are deeply interconnected with the global financial system. If they fail, the shockwaves will be felt everywhere.
📈 The next financial tsunami will begin offshore — but it’s the onshore world that will be hit the hardest . So don’t keep large sums of money in the bank, guys. Once your funds are in the bank, they’re no longer truly yours — they belong to the bank. Your account can be frozen, blocked, seized, taxed, or even converted into shares (as happened in Spain in 2011).
⚠️And remember: banks can fail. They will fail. And when they do — the government won’t save you.
Yours truly,
Greg🌹

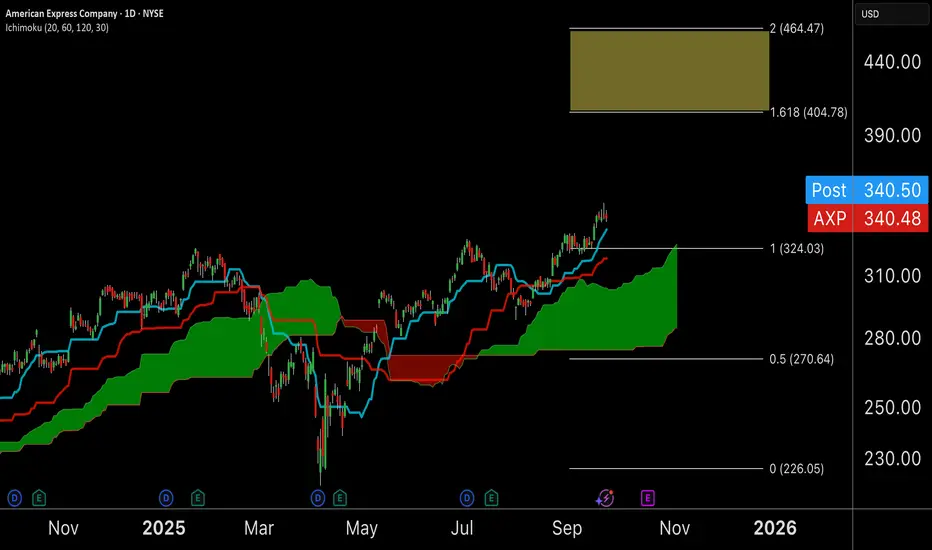
AXP Multi Month Cup and Handle BreakoutAXP has been on a monster bull run and the strength continues with positive technicals all around.
Cup and handle has broken out and is consolidating around the $340 level. While momentum is slowing down we are setting up for a strong push with seasonality + rate cuts as tailwinds
Target is +18-35%
Option contract for Nov 21 up 100% already and I will be upping sizing with a daily close above $340
Undervalued Fintech Just Hit 110M Users: Nubank ($NU)The Case for Nubank NYSE:NU
Nubank is a combination of growth and value in the fintech space. I personally like it when, as an investor, I find a stock that is a growth and value stock simultaneously.
Nu is trading at a P/E of 31.5x, and the company is a compelling story with upside potential as Latin America's leading digital bank continues its rapid expansion.
The LATAM market still has lots of underbanked people, but Nubank offers the neobank and digital services necessary for those people.
The fact that it amassed 110 million clients in just a few years tells us something. The clients are mostly in Brazil, Mexico, and Colombia, but the company is planning expansion to other countries, including the US
Remarkable Financial Trajectory (2023-2025)
Revenue Growth Acceleration:
2023: $3.37B total revenue
Q2 2025 alone: $3.36B revenue. Q2 2025 alone had the same revenue as 2023. Truly impressive
Very strong quarter-over-quarter growth and operational leverage.
Key Financial Metrics Progression
P/E Evolution: From 90x+ (growth phase) → 31.5x (profitable growth phase)
Revenue CAGR: 63.4% demonstrating consistent market penetration
EPS Growth: 63.2% three-year average showing operational leverage
User Growth: 30M → 110M+ (4x in 5 years) with improving unit economics
Investment thesis: Why Nubank is undervalued
1. Valuation arbitrage
Current P/E: 31.5x vs. US fintech peer SoFi NASDAQ:SOFI at ~50x
Growth-adjusted valuation: 63% revenue growth at 31x P/E = 0.49 PEG ratio (anything under 1.0 is attractive)
International discount: Market applying "emerging market penalty" despite superior fundamentals
2. Proven Business Model Scalability
The 2023-2025 data eliminates key execution risks:
Growing profitability across multiple quarters
Growth maintained at scale (110M+ users, still growing)
Margin expansion demonstrating operational leverage
Multi-year consistency reducing one-time success concerns
3. Structural advantages in underserved arkets
Digital-first cost structure: 80%+ lower cost base than traditional banks
First-mover advantage: Dominant position in Brazil, early leadership in Mexico/Colombia
Network effects: Growing ecosystem creates switching costs and viral acquisition
Regulatory tailwinds: Government support for financial inclusion across Latin America
4. Multiple Expansion Catalysts
Near-term (1-2 years):
US market expansion announcement
Continued profitability growth reducing "emerging market risk" perception
Potential inclusion in major indices (MSCI, etc.)
Medium-term (3-5 years):
Cross-border payments and remittance products
Small business lending expansion
Insurance and wealth management scaling
Geographic Expansion: The untapped opportunity
Brazil (Mature Market)
Market-leading position providing stable cash flow foundation
Still room for product penetration (insurance, wealth management)
Mexico/Colombia (Growth Markets)
Early-stage penetration with massive TAM
2025 data suggests strong traction in these markets
US Expansion (Game Changer)
Management indicated plans for US market entry
Could unlock premium US fintech valuations (40-50x P/E multiples)
Remittance corridor between US and Latin America represents $100B+ opportunity
Risk-Reward Analysis
Conservative 5-Year Scenario:
Earnings growth: 25% CAGR (conservative given 63% current growth) = 3x earnings in 5 years
Multiple expansion: P/E re-rating to 45x (still below SoFi's 50x) = 43% upside
Combined effect: 3x earnings × 1.43x multiple = 4.3x total return
Base Case Assumptions:
Revenue growth slows to 20-25% annually (from current 63%)
P/E expands to 40-45x as profitability matures
US expansion adds 20-30% valuation premium
Target: 3-4x returns over 5 years
Why Now??
Valuation Opportunity: 31.5x P/E for 63% growth company is historically cheap
Proven Execution: 2023-2025 data eliminates major execution risks
Market Inefficiency: US investors underweight due to "foreign" perception
Catalyst Pipeline: US expansion, product launches, and regulatory tailwinds
Target Price: $45-60 over 5 years (3-4x current levels), supported by continued geographic expansion, product innovation, and P/E re-rating as the market recognizes Nubank's transition to a mature, profitable growth company.
Conclusion
Nubank in 2025 is no longer a speculative fintech play - it's a proven, profitable, growing financial services powerhouse trading at a discount to inferior peers. The combination of 63% revenue growth, sustainable profitability, massive TAM, and 31.5x P/E creates an asymmetric risk-reward opportunity rarely seen in public markets.
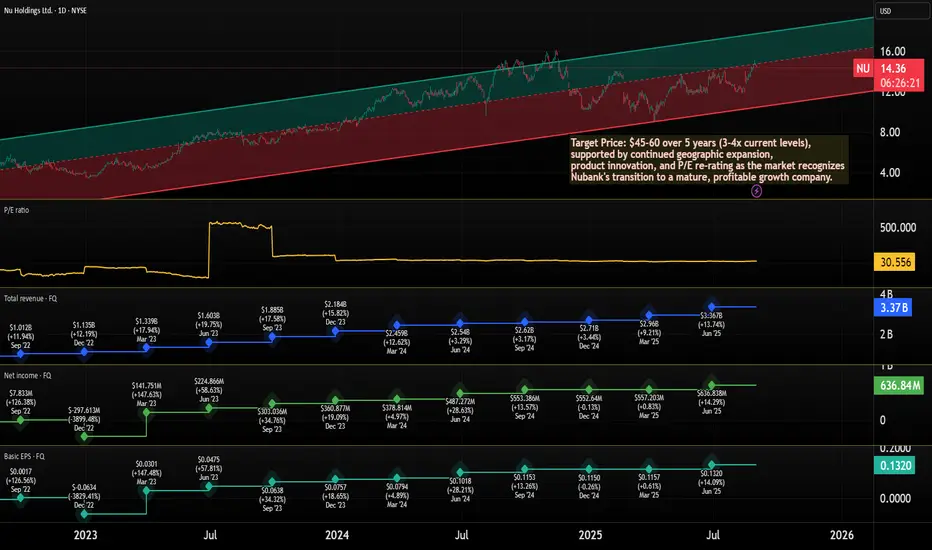
Nu Holdings (NU, 1D) — Technical AnalysisNu Holdings (NU, 1D) — Technical Analysis: Trendline Breakout, EMA/MA Confirmation, Recovery Toward Key Levels
On the daily chart, Nu Holdings has broken out of a descending trendline, signaling a potential structural reversal. The breakout was confirmed by a close above key exponential and simple moving averages (EMA 50/100/200), with the EMAs beginning to align in a bullish sequence. The price has held above the critical Fibonacci retracement level at $11.73 (0.618), which now serves as a key demand zone. Volume shows signs of increasing during upward impulses, suggesting accumulation interest. The current recovery structure indicates potential targets at $12.58 (0.5 Fibonacci), followed by $13.42 (0.382) and $14.46 (0.236). A more extended move could lead toward the previous supply zone near $16.15 if momentum persists.
From a fundamental standpoint, Nu Holdings continues to attract investor attention within the fintech sector, especially amid broader rotation back into growth and tech-driven financial platforms. The company's expanding market presence and improving financial metrics may support the current technical setup. As long as the price holds above the broken trendline and maintains strength above the key $11.73 level, the bullish scenario remains in focus with targets pointing toward the $13.42–$14.46 range and potentially higher in the medium term.

LFG - Bruised, Battered...Overlooked?Vehicle sales and personal loans are up... Is the overlooked ASX:LFG set to benefit?
Our Bullfinder-official Team has identified a potential opportunity within LFG.
If price can hold above the $3.05 mark, there may be potential for a re-rating of momentum to 'bullish'.
We would like to note however that below ~$3.05 significant bearish continuation risk comes into play.
After a solid dividend last year, will LFG continue and begin to gain traction? Time will tell...
We're inspired to bring you the latest developments across worldwide markets, helping you look in the right place, at the right time.
Thank you for reading! Stay tuned for further updates, and we look forward to being of service along your trading & investing journey...
Disclaimer: Please note all information contained within this post and all other Bullfinder-official Tradingview content is strictly for informational purposes only and is not intended to be investment advice. Please DYOR & Consult your licensed financial advisors before acting on any information contained within this post, or any other Bullfinder-official TV content.

FHN: Bearish retest after channel break – more downside ahead?First Horizon Corporation is a regional U.S. banking company offering commercial, mortgage, and investment services. It operates mainly across the southern United States and is among the largest regional banks in its sector.
Technical Analysis:
FHN recently broke down from a long-term ascending channel and is now retesting the lower boundary as resistance. Price stalled near 18.65 with weakening bullish momentum. RSI is trending lower and volume on retest is soft. Key downside levels: 15.00, 13.50, and possibly 10.24 if weakness continues.
Fundamentals:
FHN faces headwinds from tightening monetary policy, rising credit costs, and profitability pressures. Regional banks are under investor scrutiny following sector instability. Latest earnings report showed declining margins and weaker guidance.
Scenarios:
Bearish bias – rejection at 18.65 → drop toward 15.00 → 13.50 → 10.24
Bullish reversal – break back above 18.65 → re-entry into channel toward 21.00+

Quantum's BAC Trading Guide 4/8/25BAC (Bank of America Corporation) - Sector: Financials (Banking)
Sentiment:
--Neutral (slight bullish tilt). Pre-market options lean call-heavy, RSI likely ~48 (up from ~45 with +1.8% from $35.58 to $36.23), X posts overnight mixed—rate fears vs. recovery hopes—suggesting a bounce from $34.19 (April 4).
Tariff Impact:
--Moderate. 10% tariffs could hit loan demand (trade-sensitive clients), but BAC’s diversified revenue softens impact. Sentiment drives here.
News/Catalysts:
--Consumer Credit (April 8) key—strong data could lift BAC; X posts on banking resilience or tariff delays might boost today.
Technical Setup:
-Weekly Chart:
---HVN near $37 as resistance, weekly low ~$34 as support (April 4: $34.19).
---Sideways (8-week EMA ≈ 13-week ≈ 48-week, reflecting $35–$40 range).
---RSI ~48 (neutral),
---MACD near signal (histogram flat),
---Bollinger Bands near midline,
---Donchian Channels at midline,
---Williams %R -50 (neutral).
-One-Hour Chart:
---Support at $35.58 (prev. close), resistance at $36.68 (day high), weekly alignment.
---RSI ~50, MACD near signal (histogram flat),
---Bollinger Bands near midline,
---Donchian Channels at midline,
---Williams %R -48 (neutral).
-10-Minute Chart:
---Pre-market uptick to $36.23, 8/13/48 EMAs flat-to-up, RSI ~52,
---MACD flat near zero.
Options Data:
--GEX: Neutral (slight bullish tilt)—pinning shifts mildly upward.
--DEX: Neutral (slight bullish tilt)—call delta edges out puts.
--IV: Low—~20–25% vs. norm 25–30%, steady post-drop.
--OI: Balanced (slight call tilt)—OI leans above $36.
--Directional Bias: Neutral (slight bullish tilt). GEX’s mild upward pinning, DEX’s call delta hint at buying, low IV limits big swings, and slight call-heavy OI nudges up—neutral with a bullish edge.
Sympathy Plays:
--JPM (JPMorgan Chase): Rises if BAC gains, falls if BAC fades.
--WFC (Wells Fargo): Gains with BAC upside, drops if BAC weakens.
--Opposite Mover: BAC rallies → cyclicals like ALK fade; BAC dumps → JPM/WFC soften.
Sector Positioning with RRG: --- Financials (Banking).
--RRG Position: Improving Quadrant. BAC’s bounce from $34.19 lifts it vs. XLF.
Targets: Bullish +2% ($36.95, hourly resistance); Bearish -2% ($35.50, hourly support).

Jefferies: Maintains "Buy" Rating with a €6.25 Target PriceJefferies: Piraeus' Acquisition of National Insurance Boosts Profitability and Capital Position – Maintains "Buy" Rating with a €6.25 Target Price
The acquisition of 90% of National Insurance by Piraeus Bank for €540 million is a highly strategic move that, according to Jefferies' analysis, will significantly enhance the bank's profitability and overall financial position.
A Deal That Strengthens Piraeus – “Buy” Rating Maintained
Jefferies estimates that the National Insurance acquisition diversifies Piraeus' revenue streams and strengthens its fee income sector, bringing it closer to leading European banking institutions.
The investment firm maintains its “buy” rating for Piraeus Bank, setting a €6.25 price target, confirming its confidence in the bank’s prospects following this strategic move.
Profitability & Return on Equity Boost
This transaction is expected to increase earnings per share (EPS) by approximately 5%, while return on tangible book value (RoaTBV) is projected to rise by 100 basis points (bp). At the same time, Piraeus continues to target a cost-to-core-income ratio of around 35% for the 2025-2027 period, maintaining strong operational efficiency.
Positive Capital Impact – Danish Compromise Implementation
The acquisition will impact Piraeus’ total capital ratio by 150 basis points, reducing it from 20% to over 18.5% in 2025. However, the bank plans to apply the Danish Compromise, which, if implemented, would reduce the impact by 50 basis points, keeping the net effect at 100 basis points.
Importantly, the CET1 ratio is expected to remain above 13% throughout the 2025-2027 business plan, while the dividend distribution policy at 50% of profits remains unchanged.
National Insurance: A Leading Player in the Greek Market
National Insurance is the top insurance company in Greece, with 15.8% growth in gross written premiums (GWP) in 2024, surpassing the market average of 8.7%. The company is expected to maintain a 14.6% market share in 2024, with 17% in life insurance and 11% in general insurance.
With total assets of €4 billion and equity of €400 million, National Insurance reported normalized net earnings of €100 million in 2023. Its extensive network of corporate and affiliated insurance agencies generates a significant portion of its revenue.
Strong Growth in the Bancassurance Market
Piraeus Bank expects the Greek insurance market to continue expanding, with gross written premiums rising to €7 billion from €5.5 billion by the end of 2024.
In Bancassurance, a key strategic sector for Piraeus, the market size is projected to grow from €1.4 billion to €2 billion, highlighting the increasing significance of bank-led insurance services in Greece.

$KBE’S BANKING BOOM—Q4 STRENGTH & POST-ELECTION SURGEAMEX:KBE ’S BANKING BOOM—Q4 STRENGTH & POST-ELECTION SURGE
(1/9)
Good morning, Tradingview! AMEX:KBE ’s riding high—up 8.3% since the Nov ‘24 election, beating AMEX:SPY ’s 3.3% 📈🔥. Banks are cashing in on trading and dealmaking post-election. Let’s dive into the AMEX:KBE rally! 🚀
(2/9) – PERFORMANCE & REVENUE
• Post-Election Gain: +8.3% vs. AMEX:SPY +3.3% 💥
• Q4 Revenue Growth: Holdings ( NYSE:GS , NYSE:JPM , NYSE:BAC ) up 5-10% YoY
• Sector EPS Est.: +7-8% for Q4 2024
Fixed income trading and investment banking are fueling the fire!
(3/9) – BIG EVENTS
• Pro-Business Vibes: Deregulation hopes lift sentiment 🏛️
• M&A/IPO Surge: Banks thriving in deal flow 📊
• NYSE:GS Q4 Est.: GPW:11B + revenue, +5-7% YoY 🚗
X posts buzz about a banking renaissance!
(4/9) – SECTOR SHOWDOWN
• AMEX:KBE : +8.3% vs. AMEX:XLF +6%, AMEX:IWM +5.4% 🌍
• Forward P/E: ~10x ( AMEX:KBE ) vs. 12x ( AMEX:XLF ), 20x ( AMEX:SPY )
• P/B: 1.2x vs. AMEX:XLF ’s 1.5x
Undervalued vs. peers, but banking focus shines!
(5/9) – RISKS TO WATCH
• Rates: Rising costs could pinch margins 📉
• Trade Policy: Tariffs might slow deals ⚠️
• Loan Demand: Weakness or credit dips a threat 🏦
• Sentiment: Undervaluation lingers—earnings key!
(6/9) – SWOT: STRENGTHS
• Trading Power: FICC up 10% in Q4 🌟
• Dealmaking: Top banks lead M&A/IPO surge 🔍
• Low Cost: 0.35% expense ratio beats most 🚦
AMEX:KBE ’s got muscle in the banking game!
(7/9) – SWOT: WEAKNESSES & OPPORTUNITIES
• Weaknesses: Cyclical reliance, bank-only focus 💸
• Opportunities: Deregulation, 10-15% earnings pop in ‘25 🌍
Can AMEX:KBE cash in on policy and growth?
(8/9) – AMEX:KBE ’s Q4 strength—where’s it going?
1️⃣ Bullish—Banks keep soaring.
2️⃣ Neutral—Growth holds, risks balance.
3️⃣ Bearish—Rate woes hit hard.
Vote below! 🗳️👇
(9/9) – FINAL TAKEAWAY
AMEX:KBE ’s Q4 glows—trading and deals lift banks high 🌍. Cheap at 10x P/E, but risks lurk. Undervalued gem or cyclical trap?

XRP FINAL STEEP DISCOUNT OPPORTUNITY IS IMMINENTMy time-wave cycles analysis (among other components) indicating we will have a final sell wave to 1.45-1.7 zone over coming days (before FOMC meeting in March imo).
Granted I was a little off on exact timing to reach the buy-side targets back in December but nonetheless accurate on projected price levels..See prior analysis at attached link for the projected high coming in at 3.1-3.3, exactly as it happened...
I have no doubt this final sell wave will also occur. Depending on your goals & trading style, you may treat this next sell wave as an opportunity to simply add more at discounted levels via DCA'ing....or choose to sell at these relative highs to maximize position size once again from sub-1.70 levels.. I DO NOT EXPECT US TO SEE sub-3$ ANYTIMEagain after this next sell wave completes & then buyers take us to 4+ in q2 & beyond.
Expecting this to be the FINAL steep discount buying opportunity for those interested in maximizing their capital purchasing power for long term speculative hodling
Follow for additional actionable alerts & analysis. Appreciate the boosts & looking forward to your comments as well!

Citigroup ($C): Fourth Test of Key Levels Since 2018The shares of Citigroup gained an impressive 7% today following its earnings report, which delivered a beat ✅. The company is projecting revenue between $83.5 billion and $84.5 billion for 2025, up from $81.1 billion last year and $77.1 billion in the year prior (excluding divestitures). Positive news for both the company and its investors!
We’ve been monitoring NYSE:C but haven’t found a trigger yet—this might change soon.
The stock is approaching its most significant resistance zone since 2018, a level tested three times in the past. Could the fourth test finally break through? We remain cautious, expecting that another pullback, even a minor one, might be necessary to push past $83. If this pullback materializes, we’ll evaluate opportunities to position ourselves.
Currently, there’s a bearish RSI divergence, and unless the stock can make a higher high compared to 2021, another major pullback remains possible. However, a short position doesn’t align with our strategy at the moment. We’d need to see a lower time frame structure change to consider that route.
This stock doesn’t lend itself well to Elliott Wave analysis as it has been trending sideways for years, and we’re not forcing patterns onto it.
Stay alert for future opportunities on NYSE:C

4 Big Banks and their relation to KBEWeekly time frame....White line front runs a
change in direction...be it temporary or permanent
to long to explain...but white peak before blue peak
and things head down...if blue continues with white
or stays flat...there is little change to direction
or price just chops sideways a bit.
use other indicators to confirm...but white line can
bounce off or hug envelope channel and explain price
--------
The 4 headless horsemen of banking are next to each other...
Does something seem quite interesting among them since each is way different in area of investment...political control...money-metals exposure....MBS and the like...
So why are three pretty close to copies if you glance for more than a second or two, yet the fourth is somewhat similar but trending differently...
Just an interesting thought experiment

Goldman Sachs... GS looks like a top unless they pump moreLike the prior Idea of mine...most things have given back the Trump-bump election push and are on the way down or skating on thin ice and ready to begin a hard fall.
This has shown similar patterns from previous times.
The lines are hull moving averages or averages that are envelope or 3x exponential. mix them together and you get predictors that are pretty good in general.

Goldman Sachs ... simple levels, earnings and future tradeUsing simple lines that are from key pivot points and using a "Bow string method"- taking a fib channel and connecting to highs or lows and putting the third point of the channel tool on the lowest or highest point between the first two highs or lows respectively.
You can see a top may of been in along the top line...granted it was due to the election crack up boom attempt number 1...probably 4 more coming to try and prop things up.
Anywho...here are all the touches to show congruence back to 2009...the last time a crap load free-falled into the bowl that is the economic market.
Check out the Minds on here about GS I'll put up for more analysis showing why i say that top line is quite significant...

Goldman Sachs ($GS): Trend Channel in FocusGoldman Sachs has been trending higher since our analysis two months ago, prompting us to reevaluate our stance. We’ve concluded that it makes more sense to remain bullish for now and not anticipate a bearish scenario at this stage. We are particularly encouraged by how consistently NYSE:GS has respected its trend channel, which strengthens our belief that it will continue to hold. However, there is a significant concern: we don’t want to see NYSE:GS losing this trend channel or creating a false breakdown, only to trap bears and continue higher.
Goldman Sachs has its earnings call scheduled for the same day as BlackRock and JP Morgan this Wednesday. This adds pressure, and with additional uncertainty from the upcoming political shifts, such as the inauguration of Trump, the potential impact on NYSE:GS , NYSE:BLK , and NYSE:JPM remains unclear.
Setting a limit at the 23.6%-38.2% Fibonacci levels feels too risky given the current environment and the uncertainty in the near future. While we favor this updated bullish scenario over the previous one, the bearish scenario isn’t entirely off the table. It could quickly come back into play if NYSE:GS loses key support levels.
For now, NYSE:GS needs to touch the $536–$489 zone and reclaim the trend channel promptly to validate our bullish scenario. If it fails to do so, we’ll need to approach with extreme caution, and as a result, we are not rushing into a trade at the moment.

JP Morgan (JPM): Correction on the HorizonJP Morgan ( NYSE:JPM ) is back on our radar as the upcoming earnings season begins, with the banking sector leading the reports. We’ve analyzed JP Morgan before, and the current setup offers intriguing opportunities. Since 2023, the stock has maintained a steady upward trend that continues into 2024.
Currently, NYSE:JPM appears to be in sub-wave ((iii)) within the larger wave (3) or possibly wave 5. However, we anticipate that sub-wave ((iv)) correction is yet to occur, aligning with the broader structural narrative of the chart.
Presently, the stock is trading near a critical trendline originating from the top of sub-wave ((i)). This trendline, which has shifted from resistance to support after multiple touchpoints, now risks being broken. Should it fail, the price could fall from its current level of $243 into a range between $204 and $173. A drop to $173 would represent the maximum correction in our view, while a more realistic pullback would fall within the $204 to $188 range.
On the bullish side, the wave 5 could push up to approximately $260, a modest increase from the current price. This scenario fits within the Elliott Wave framework, anticipating a wave ((iv)) correction before the final upward moves to complete wave 5 and the larger wave (3).
