Dow Jones Trend Continuation: Advanced Pattern, Simple TradeWe’re on the Dow, and the trend is bullish. You don’t need indicators to see it—just look at price. We recently had a breaking close above the previous high, followed by consolidation. That matters, because advanced patterns tend to form during pauses in the market, not during explosive moves.
Inside this consolidation, we can map out a potential bullish Gartley pattern. Because this pattern is forming within an uptrend, it can also be used as a trend continuation setup as well.
3 Ways to Trade It
1) Trade it as a standalone Gartley
2) Trade it as a pullback in a bullish trend
3) Or combine both—partial profits on the Gartley, runners for continuation
Entries are clear, stops sit below structure, and whether you’re targeting a retest of highs or new highs, the risk-to-reward is excellent.
If you have any questions or comments please let me know & I look forward to giving you guys more videos throughout the year.
Akil
Gartley

ETHUSD BUY 2838On the 4-hour chart, ETHUSD is currently trading in a range. In the short term, pay attention to the support level around 2838, which is a potential buy point for a bullish Gartley pattern.

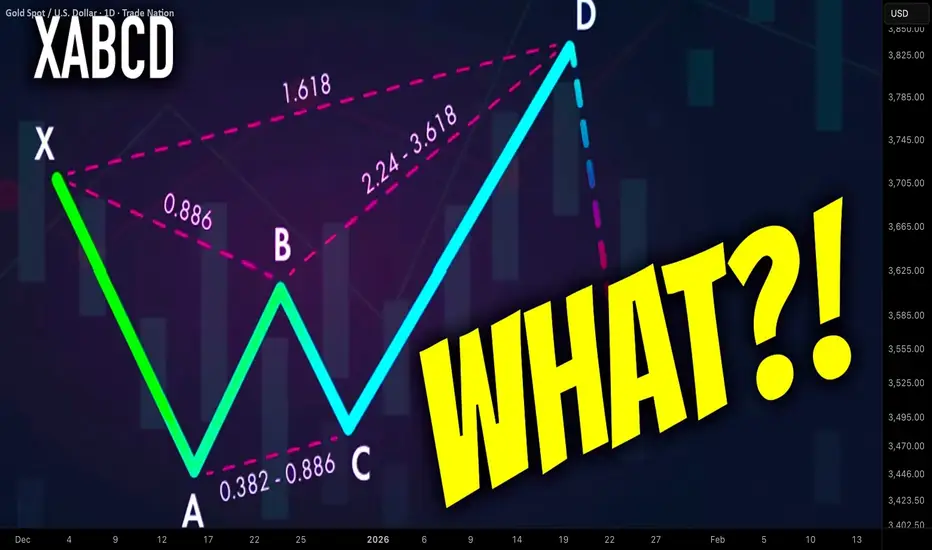
What is Harmonic XABCD Pattern and How to Identify It Easily
In the today's article, we will discuss the absolute basics of harmonic trading: I will explain to you what is harmonic ABCD pattern and how to recognize it, using fibonacci ratios.
The foundation of harmonic trading is impulse leg.
Impulse leg is a strong, directional bullish or bearish movement.
Harmonic traders perceive a price chart like a combination of impulse legs.
Here are the impulse legs on AUDUSD on a daily time frame. All these impulses are significant bullish or bearish movements.
In harmonic pattern trading, the impulse leg will also be called the XA leg.
XABCD pattern is based on 4 consequent price movements.
XA leg will be a fundamental component of each harmonic XABCD pattern and the first price movement within the pattern.
The direction of the XA leg will determine the bias of the pattern:
Bullish XA will be a foundation of a bullish harmonic pattern,
while, a bearish XA leg will be a foundation for a bearish harmonic pattern.
Above, the examples of a bullish and bearish impulse legs.
After identification of XA leg, a harmonic trader should analyse a consequent price action.
AB leg will be the next movement after a completion of XA leg.
BC leg will be the movement after a completion of AB leg.
CD leg will be the movement after a completion of BC leg.
CD leg will be a completion point of a harmonic pattern.
In a bullish harmonic pattern, a bullish movement will be anticipated from D point.
Above is a structure of a bearish harmonic XABCD pattern.
There are a lot of different types of harmonic XABCD patterns: bullish/bearish Gartley, Bat, Cypher, etc...
The type of the pattern will depend on the fibonacci ratios of B, C, D points of the pattern.
B, C, D points should have very specific ratios to make a pattern harmonic.
First, a harmonic trader should measure the fibonacci retracement level of B point in XA leg.
In the example below, B point is lying between 618 and 786 retracements of XA leg.
Then, if a C point is lying beyond the range of the XA impulse, one should measure its fibonacci extension level.
If a C is lying within XA, its retracement level should be measured.
Below, we can see that C point of the pattern is lying between 618 and 786 retracements of AB.
Depending on the type of the pattern, a D point will either be based on a certain fibonacci retracement of XA leg or extension of AB leg.
In our example, the criteria for a bullish harmonic Gartley pattern are met.
The completion point of the pattern - D point will be based on 786 retracement of XA leg.
From that retracement level, a bullish movement will be anticipated.
Your task as a harmonic trader is to learn the specific rations of each harmonic pattern. With experience, you will learn to identify impulse legs and trade them profitable.
❤️Please, support my work with like, thank you!❤️
I am part of Trade Nation's Influencer program and receive a monthly fee for using their TradingView charts in my analysis.
Motorola Solutions, Inc. (MSI) – Long Setup Technical AnalysisMotorola Solutions, Inc. (MSI) – Long Setup Technical Analysis
MSI is currently trading above the Anchored VWAP, where a bullish Gartley harmonic pattern has formed precisely at the main Anchored VWAP level. This alignment highlights a technically clean value-based reaction zone, with price respecting volume-weighted fair value.
The Gartley structure suggests a controlled corrective move within an intact bullish framework, rather than distribution. The precise interaction with the Anchored VWAP reinforces the view that institutional participants are defending this level, maintaining constructive market structure.
From a tactical perspective, this configuration favors a long continuation setup. As long as price maintains acceptance above the main Anchored VWAP, the probability favors a renewed upside rotation toward prior highs and upper value areas.
Bias: Long on bullish reaction at the Anchored VWAP
Target: Upside continuation toward prior highs
Invalidation: Sustained acceptance below the Anchored VWAP
Context: Bullish Gartley completion + Anchored VWAP support = high-quality long setup

The Gartley at play? EUR/USD making a move...I have been building short positions since end of June/early July based on my original trade idea (which is still open)
....However, I noticed a potential harmonic pattern on the weekly about 3 weeks ago and this strengthened my conviction to keep and add additional shorts when we consolidated around the 1.1800+ price zone.
Although I am a chart pattern trader, I'm not a traditional harmonic trader but certain price action stands out to me and this looks like one playing out.
If this does qualify as a Gartley in play, I noticed in past patterns that when the B - C leg is shallow, the price tends to exceed C and eventually A,...BUT when the B to C wave is lengthened, price tends to drop and stall half way of the pattern before continuing the ultimate trend (In this case Bullish).
I'm still looking for my original target zone of 1.1200 - 1.1100 and if we do trade there, I will be looking for long positions as I believe the DXY (U.S. Dollar) is going to get hammered in early 2026.
I'm not sure what the fundamental catalyst will be but looking at the long term charts, this seems like a strong possibility.
This will set up a nice 1000+ pip trade for the EUR/USD Bulls.
To avoid getting too ahead of myself, I'd be looking at the first hurdle right now which is 1.1500 and stay capped below 1.1750 - 1.1800.

USOIL - Type II Bulish GartleyUSOIL is completing a Bullish Gartley at the 0.786 retracement (56.70–57.30), positioned inside a strong demand zone and supported by RSI divergence + VPVR low-volume rejection.
Expectation:
A bullish reversal targeting mean reversion toward 60.00–61.00.
Entry:
Buy inside 56.70–57.30 (aggressive) or wait for bullish confirmation (conservative).
Stop Loss:
56.20–56.60 below PRZ and demand invalidation.
Targets:
TP1: 59.20–59.60
TP2: 60.80–61.20 (POC magnet)
TP3: 63.00–63.50 (runner)
Rationale:
Gartley completion + structural demand + RSI divergence + VPVR reversion =
strong probability of bullish corrective movement.

XRP USDT - HARMONIC GARTLEYI am observing Harmonic Gartley for XRP USDT on a weekly chart.
If it crosses death valley, it seems possible to reach 2 USDT by mid-October.
Of course, this is not investment advice , it is my personal analysis.
Good luck.

Bullish GartleyShort a correction back to ~$83k
Long to $100k+
SL for short above local highs
SL for long below $80k low

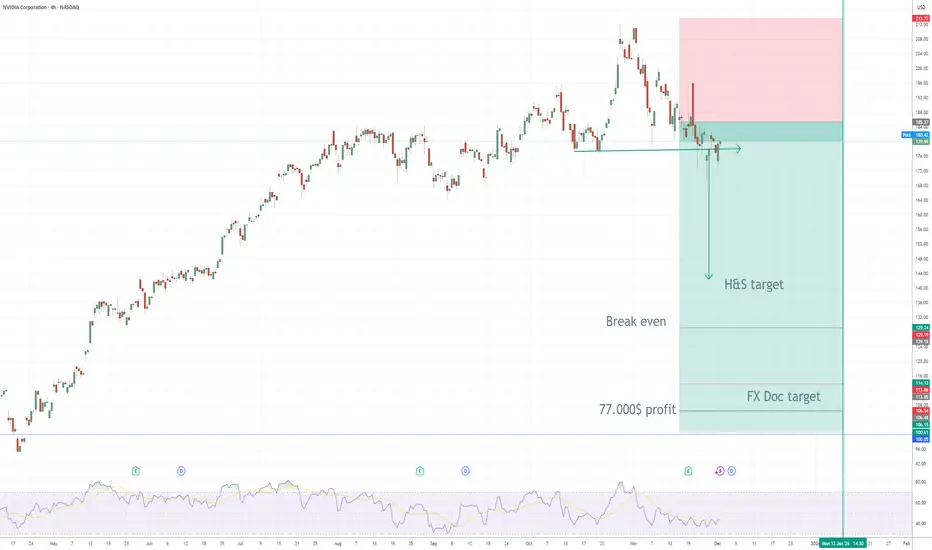
NVIDIA (NVDA) – My PUT Options Position ExplainedI opened a medium-term bearish position on NVDA by purchasing PUT options.
Here’s the full breakdown of the idea, entry logic, and projected targets.
🧠 Why I Entered the Trade
NVDA formed a clear Head & Shoulders (H&S) reversal pattern on the 4H chart — one of the strongest technical reversal signals after an extended bullish trend.
The neckline has now been broken, validating the structure and confirming bearish momentum.
The rejection from the right shoulder, combined with weakening RSI and loss of key market structure, provides additional confirmation.
🎯 My PUT Options Position
I purchased PUT contracts with a defined risk and leveraged downside exposure.
Break-Even Price: ~129 USD
This is the key level where:
the option premium is fully recovered
the position shifts from “loss” to “profit”
As long as NVDA trades below 129 USD before expiration, the position begins generating profit.
💰 Profit Projection
My profit target zone is around 102 USD.
At that level, the trade yields approximately:
➡️ +77,000 USD profit
This aligns with:
the measured target of the Head & Shoulders pattern
previous demand zone turning into resistance
Fibonacci extensions
a full correction of the last impulsive leg
📌 Technical Breakdown
H&S target: ~160 → ~130 → projected extension toward 102
Break-even: 129 USD
FXDoctor target: 102 USD
Trend structure: Major lower lows forming
Momentum: RSI breakdown and bearish continuation signals
The chart clearly shows a potential shift from a hyper-parabolic bullish phase into a deeper correction — a move that benefits PUT buyers with asymmetric risk/reward.
🧨 Summary
I’m holding PUT options on NVDA
Break-even: 129 USD
Projected profit: ~77,000 USD at 102 USD
The trade is based on a clean and validated Head & Shoulders reversal
NVDA is showing early signs of a much larger bearish correction
CCAP - good opportunity, normal risk CCAP - EGX30 - Timeframe 1 day
Format a Gartley bullish pattern as follows:
- Entry: 2.45 (current price: 2.39)
- Stop loss: 2.35 (potential loss: 5%)
- First target: 2.73 (potential profit: 10%)
- Second target: 2.98 (potential profit: 20%)
Important notes:
1. Activate the stop loss if it is triggered, as there are lower entry levels for this pattern (down to 1.75).
2. Prices may rebound from this point.
This is not investment advice, only my analysis based on chart data.
Consult your account manager before investing.
Thanks and good luck.

USDCAD - A Somewhat Confusing Homerun Trading SetupsTop Trading Idea of the Week #2 is on USDCAD, and it’s a two-part bullish opportunity. It begins with a potential bullish Gartley pattern currently setting up—already a strong technical signal. But what makes this idea particularly compelling is the broader market context. On the higher timeframe, USDCAD has been stuck in a massive consolidation since 2015, and while it isn’t technically forming an ascending triangle, the path of least resistance still appears to be to the upside.
Because of that, this may be a rare chance to aim for extended—or “home run”—targets. However, whenever I look to stretch targets, I always want to be aligned with the fundamentals as well. So in the video, we’ll walk through both the technical setup and the additional fundamental research required to build a confident, well-rounded bullish thesis.
If you have an fundamental insights that you'd like to share I'd love to hear about it below. And as always please leave any questions, comments or ideas there as well.
Akil

EURUSD - why am I bearish on the priceWell, thank you for commenting on my ideas on EURUSD. This is what makes the TradingView community unique.
In one of the comments I learned that I am agains the mainstream believing that EURUSD is not going to continue growing (will not hit the next max after 1.19191 on Sep 15th). In this post I would like to provide arguments for which I am bearish in EURUSD, yet keeping in mind that those are just my humble opinions and as such they can be completely wrong.
So, let's do that:
Argument #0 - EURUSD in W1 in in Downtrend since June 2008
Argument #1 - Overbalance - total size of the corrections (marked light blue) are almost equal. Yet the recent correction perfectly is aligned with Garttley pattern (Argument 4).
Argument #2 - The BC parts of the above mentioned corrections are equal too (marked navy blue)
Argument #3 - the recent correction has performed a perfect ABC pattern
Argument #4 - The above mentioned Gartley pattern (I wrote a post on that) has been completed
Argument #5 - last but not least - the price returned exactly on Fibonacci Retracement 161.8 of the most recent correction to the up-movement starting on Sep 30th 2024.
Those argument create a massive Resistance Cluster at 1.17500 - 1.19600.
Altogether I have six argument to believe the local uptrend on EURUSD simply expired. But of course I may be absolutely wrong and EUR will go up from where it is now.
Just my humble opinion

Gartley setup in the Canada …Gartley pattern, closing in on counting complete @13920-40. See if we can hit and reject

BRENT gartleySneaky gartley printed on H4 tf on Brent crude. If proves to play out we should see much upside from oil in the coming days/weeks.

$CLSK: Gartley Harmonic projects to $34NASDAQ:CLSK : if BTC resumes uptrend, this bearish Gartley Harmonic finishes around $34, after which a large drop is expected.
This will be invalidated if BTC has entered a bear market.

BTC and USDT.D - Marco Harmonic PatternsHere you can see a marco harmonic pattern forming where the Gartley could print on a large macro, and smaller Deep Crab to get us there. BTC will pump while USDT.D goes down, but that will be the final move for a, potentially, cycle top. Let see...

BTC - The Best Gartley Reversal of ALL TIME??This Stuff is happening pretty quickly, trades need to enter, there isn't much time...I suspect...
This 1 hour Bullish Gartley is lining up perfectly to a reversal here. If this doesnt hold, a larger correction will form in a Crab. Lets see...

HISTORICAL HARMONIC EGJust happened to look back and see how harmonic EURGBP has been during recent times. Will it contine?

$103,000 Support is Your Next Long Entry!The chart shows a Bearish Harmonic Pattern (D point completed near $107,000), indicating the recent bullish momentum needs a rest.
We anticipate a short-term pullback following the completion of this pattern.
The target for this drop is the key support area (green box) around $103,000 - $103,500.
OBV also shows Bearish Divergence (price up, indicator down), which strongly supports the idea of a temporary pullback.
Wait for the price to hit the $103,000 support zone.
Look to enter a LONG trade from the $103,000 - $103,500 area for the next major leg up. This is the main opportunity!
Good Luck!

DCRUSDLooks like Decred is ready for a huge race in the next hours. Let's see how it performs.
This is not a financial advice. Do Your Own Research

LTCUSD SELL 119.2On the daily chart, LTCUSD has stabilized and rebounded in the short term. At present, attention can be paid to the resistance around 119.2, which is a potential shorting position for a bearish Gartley pattern. At the same time, this position is within the previous supply zone.

$CLSK: short term bullish Gartley NASDAQ:CLSK : bullish Gartley Harmonic has XD = 78.6%. NASDAQ:CLSK has exceeded this ratio slightly. Bullish Bat's XD ratio is 88.6%, this week's low aligns with this ratio.
The bullish Gartley appears to have completed and prices should start to recover.
If the broader market drops, AB = CD can target $13.50, which would present an excellent opportunity to add. I'll be adding to my position in the buy zone if the opportunity presents itself.
Additionally, the buy zone aligns with the last triangle congestion area, which gives more confidence that this area has strong support.
I added some today. If it goes down more tomorrow, I plan to add more.

EURUSD - the Gartley pattern respectedFurther to my previous idea in EUR, looks like the market observed and respected the Gartley Pattern (W1). Now th key support is at 1.15. If this support is broken, the path down to 1.12 will be wide open.
Just my humble opinion.
